This handy anniversary logo is from the American Water Works Association (AWWA) which, despite its name, is an international scientific and educational association founded to improve water quality and supply of which I have been a member for over 10 years.
The SDWA was the first comprehensive regulatory framework for drinking water in the United States. Prior to SDWA, federal regulation of drinking water began in 1914 when the US Public Health Service regulated interstate water carriers such as ships or railroads. These standards were expanded in 1925, 1946, and 1962. The ’62 standards covering 28 substances, were the most comprehensive pre-SDWA federal drinking water standards and all 50 states had adopted them with varying modifications.
Believe it or not the USPHS is a uniformed service of the US by 37 USC §101. They seem to be a very confused branch because the Surgeon General, in this case Vivek Murthy, is a Vice Admiral.
SDWA Build-up
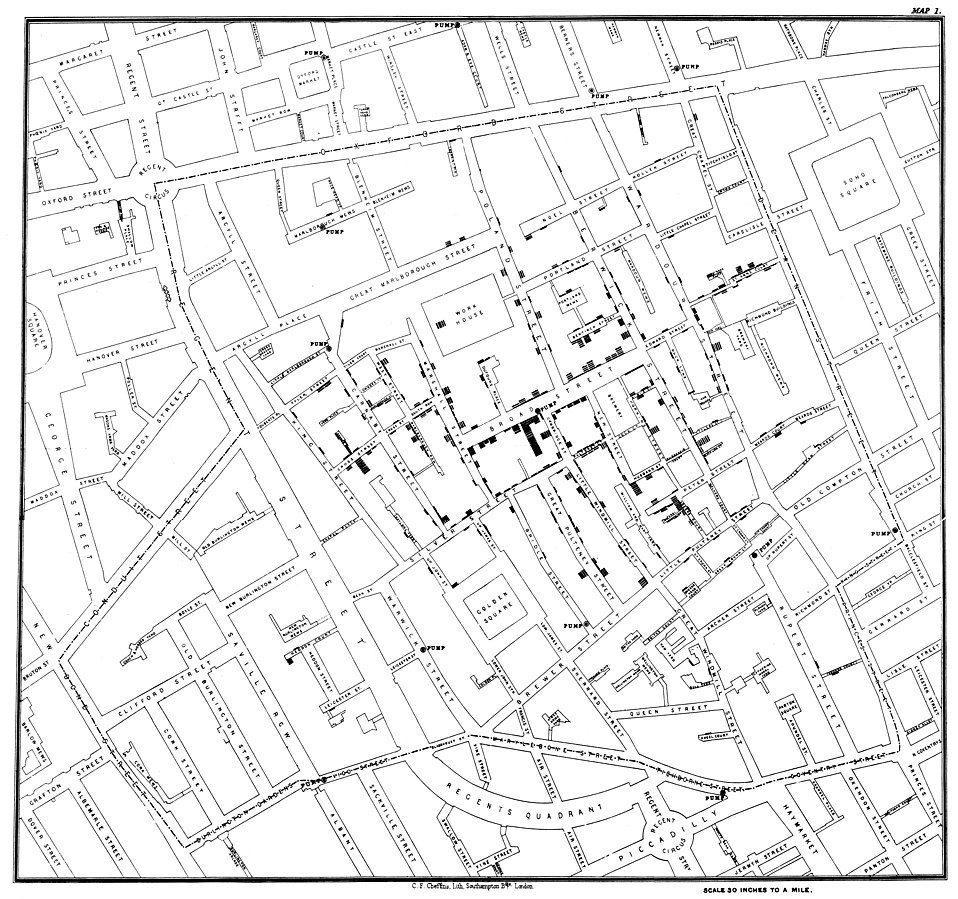
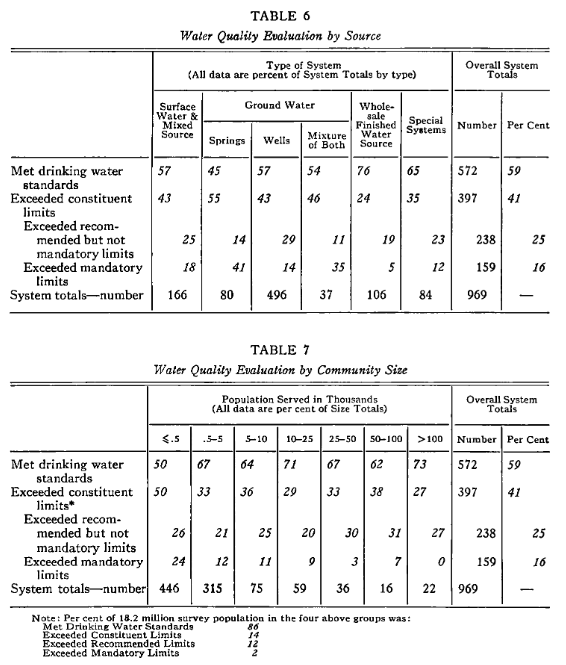
The ’62 standards did not include many industrial or agricultural chemicals which found their way into drinking water supplies at the time. Concerns around this led to the federal government commissioning water system surveys, a famous one in 1969 (published by none other than AWWA!), showed that only ≈60% of surveyed water systems met the ’62 USPHS standards. Over half of the systems surveyed had major deficiencies involving disinfection, clarification, or pressure. A Region VI study found 36 chemicals in treated drinking water sourced from the Mississippi River in Louisiana. This increasing awareness lead to a constellation of laws which work in concert with SDWA such as the Clean Water Act, CERCLA, RCRA, and many others.
Excerpt from Survey of Community Water Supply Systems by Leland J. McCabe, James M. Symons, Roger D. Lee, Gordon G. Robeck, one of the reports which lead to SDWA.
SDWA Overview
SDWA aims to protect public water supplies, it does not apply to private wells which serve about 13 million people in the US. Under SDWA, a public water supply/system does not refer to who owns it but rather if the system meets certain characteristics such as having more than 15 service connections or serving greater than 25 people so, by SDWA, a public water system can be privately owned. SDWA divides public water systems into categories based on characteristics such as where they serve customers and how often they serve the same people; systems with different characteristics have different rules. The original 1974 SDWA was heavily predicated on the ’62 USPHS standards with added requirements for monitoring, analytical standards, reporting results, record keeping, notification for failing to meet standards, and adding standards.
SDWA has a few seemingly counterintuitive features. Chief among them for the public is the concept of primacy. While SDWA is a federal standard and federal regulators determine the levels of contaminants allowed in drinking water, enforcement authority is delegated to more local bodies that meet specific criteria. Every state except of Wyoming, the inhabited territories, the District of Columbia, and the Navajo Nation all have primacy, or enforcement authority for drinking water.
While there have been several amendments to SDWA, the main amendments occurred in 1986, and 1996. After SDWA’s passage, Congress became frustrated by the slow regulatory pace at the EPA. The 1986 Amendments required EPA to set standards for 83 contaminants and make determinations to regulate an additional 25 contaminants every three years as well as to specify the best available treatment technology for removing each regulated contaminant from drinking water among other provisions. EPA categorically missed statutorily imposed deadlines and there were questions about enforcement efficacy. In the words of EPA’s 1996 water head (known as the Assistant Administrator for the Office of Water), Robert Perciasepe, in testimony to Congress on 31 January said the ’86 amendments created a “regulatory treadmill [which] dilutes limited resources on lower priority contaminants and as a consequence may hinder more rapid progress on high-priority contaminants.” Increased public scrutiny brought about major changes to SDWA in 1996. These amendments focused regulation on through risk-based standard setting, increased funding, created “right-to-know” provisions, and strengthen enforcement authorities among other provisions.
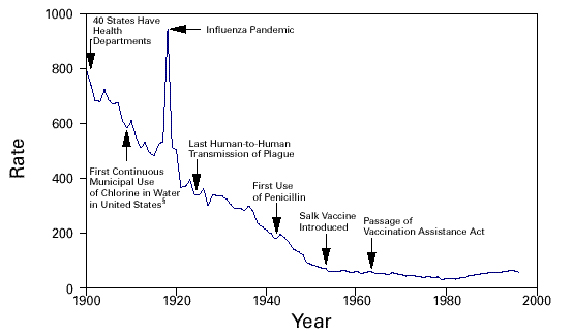
As of third quarter 2024, federal drinking water regulations apply to approximately 143,539 privately and publicly owned water systems and cover ≈87% of the US population. The US is a far cry from circa 40% of surveyed water systems failing basic standards. SDWA has achieved better drinking water quality across the United States. Water-related gastrointestinal disease outbreaks have reduced considerably with SDWA while surveillance and detection have improved. SDWA has been successful in reducing risks and improving public health through dedicated water professionals at the utility, primacy agency, and federal levels. I am proud to play a role in that joint enterprise.
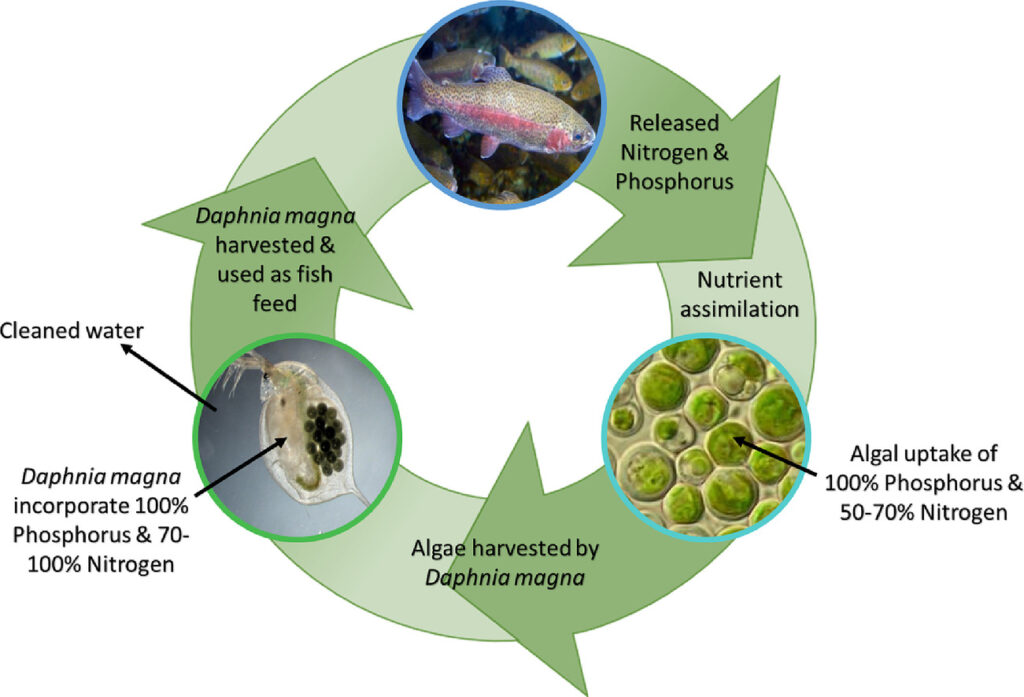
A contribution to the circular economy; fish excrete nutrients which algae take up and are then fed to Daphnia magna which is then fed back to fish.
The basic concept in my paper is that aquaculture effluent (fish farming wastewater) is high in excreted phosphorus and nitrogen which cause eutrophication in lakes and must be managed. Algae uptake nitrogen and phosphorus into their biomass and Daphnia magnaeat algae which can then be fed back to shrimp and fish larvae.
Project Summary
Recirculated aquaculture systems (RAS) are often seen as the future of aquaculture because of well-documented issues surrounding wild capture or open-net farming. One engineering problem for RAS are nutrient discharges, which cause water eutrophication (water body senescence or aging and death). Microalgae are one of the causes of eutrophication, however, microalgae directly incorporate nutrients such as nitrogen and phosphorus as well as carbon dioxide directly into their biomass. Removing microalgae from water is extremely resource intensive but Daphnia magna eat (harvest) microalgae and are a high value fish feed. These D. magna can then be fed to shrimp or fish larvae presenting a nice bio-circular economic production system. This was essentially a lab scale proof of concept for this system. The scientific details are published in the Science of The Total Environment. In future posts, I plan on going into detail some of the motivations behind this project such as eutrophication and the circular economy as well as on the ramifications of this work.
Gratitude
Standing on the shoulders of giants is grandiose for this work but I’m glad to have had tremendous help to slightly push the boundaries of knowledge outwards a little.
Musholm A/S was extremely generous in providing the wastewater used in this study.
The research was supported through the InWAP project grant by the Danish Innovation Foundation, Denmark and Department of Biotechnology, Government of India (Grant no. BT/IN/Denmark/61/KM/2018-19).
Disclaimer
In the future I really should make an omnibus disclaimer then link to it from every page.
The information and views here are my own and I do not speak on behalf of the EPA in any way shape or form. None of the information provided is intended to offer engineering, legal, financial, business, information technology, or any other possible professional advice and the information provided may contain errors or omissions. I will not accept any responsibility or liability for how you use this information. Use it at your own risk and take all steps necessary to ascertain that this information is correct.
Since my previous article on wastewater based epidemiology (WBE) for SARS-Cov-2 monitoring, there have been rapid developments. According to the World Health Organization’s 12 September 2020 update there have been over 28 million confirmed cases and 900,000 deaths worldwide making it a serious global pandemic. For comparison, last year about 1.7 million people acquired AIDS and 700,000 died. There is growing evidence that built environmental systems, particularly ventilation systems and residential plumbing systems, contribute to SARS-Cov-2 spread.
SARS-Cov-2 in the Gastrointestinal Track
The pooled SARS-Cov-2 viral RNA prevalence in stool samples from clinically confirmed cases is only estimated to be around 50% although estimates range from 15% to 84% in this meta-study and review. These studies unfortunately generally did not have many participants; between 9 and 4,243, with most studies having under 60 participants. Likewise, SARS-Cov-2 loads and viral RNA in fecal samples reported between 1,000 and 10,000,000 SARS-Cov-2 copies per fecal milliliter; one study had 153 participants, where only 44 participants (29%) had viral RNA present, while the other studies all had under 50 total participants. That study indicated that there was, broadly speaking, a traceable general shedding pattern. During the initial SARS-Cov outbreak in 2002-2003 and MERS-Cov outbreak in 2012, viral RNA was still present in stool samples over 30 days after the illness. Similarly, patients with SARS-Cov-2 in their stool continued to shed RNA viral positive fecal samples after showing negative respiratory/nasopharyngeal samples. The estimated continued positive shedding duration and percentage still shedding varied greatly but reported means vary between 11 days and 5 weeks in 20% to greater than 70% of patients that had positive stool samples. There is limited evidence to suggest that viral RNA in stool comes from live infectious viruses instead of deactivated or destroyed viruses however, testing for the live virus is difficult to do and few people try. Most studies suggest that SARS-Cov-2 in urine is rare however, some studies report its presence past negative throat swabs.
This guy has about a 50% chance of containing SARS-Cov-2 when excreted from an infected individual
SARS-Cov-2 in potable water distribution
It is extremely unlikely that SARS-Cov-2 can remain viable in potable water systems, especially in the US where 0.2 mg/L chlorine residual minimum must be at temporally farthest tap. While I could not find information on SARS-Cov-2’s survival in chlorinated water, other human coronaviruses are highly susceptible to chlorination. Likewise, I could not find information on SARS-Cov-2’s survival in non-chlorinated tap water which dominates Europe however, other human coronaviruses showed a three log removal (99.9% removal) at 23°C (73.4°F) in 10 days; at 4°C (39.2°F) human coronaviruses do not show a three log removal after greater 100 days. These results are not particularly helpful. Cold inlet tap water’s temperature is normally 10-15.5°C (50-60°F) but can vary from 3.6-“jacuzzi temperature” 39°C (38.6- ≈100°F) in the United States (low value is Anchorage, Alaska and the high value is Death Valley, California). The temperature depends on several factors: water age, water source (surface or ground), season, processed water storage, pipe depth, and ambient air temperature. In aggregate however, I cannot derive a scenario where SARS-Cov-2 would proliferate enough in potable water systems to make someone sick through showering for instance.
SARS-Cov-2 in sewers
Similar to potable water, I was unable to find information specific to SARS-Cov-2 however, information on other human coronaviruses is available. Other human coronaviruses die rapidly in wastewater with three log removal (99.9%) occurring between 2 and 4 days for all temperatures. I do not believe there is a general standard time for sewage to reach treatment plants however, most sewers are designed with a self-cleaning velocity that should be reached daily (between 0.6 m/s and 1 m/s mainly dependent on specific gravity and pipe diameter) and are generally capped at 3 m/s during max flow to prevent erosion. Rochester, NY takes about 24 hours for sewage to reach its treatment facilities which is normal and a decent average proxy. All reputable sources agree that standard wastewater treatment processes, which are designed for virus and bacteria inactivation among other things, inactivate SARS-Cov-2. Likewise, dilution occurs in sewers which should increase the minimum infective dose by lowering the virus’ concentration.
SARS-Cov-2 in residential plumbing
Sewers, unlike potable water, are not generally pressurized and are ventilated to eliminate smells. This little distinction is critical. Circumstantial evidence reported in the Annals of Internal Medicine indicated that 9 people became sick with SARS-Cov-2 from fecal aerosols. This is not the first time that a respiratory disease has been tied to sewage waste vents. The 2003 SARS outbreak at Amoy Gardens in Hong Kong was implicated in 321 cases and 43 deaths. During China’s ultra-strict lockdown, Kang complied camera footage indicating no contact between the sick apartment members and the newly infected group who lived on different floors. Among more than 200 air and surface samples collected, the only ones testing positive for SARS-CoV-2 came from the 15th floor family’s apartment and a vacant apartment’s bathroom on the 16th floor directly above. Tracer gas piped into the 15th floor apartment’s drainpipe exited in the 25th and 27th floor apartment bathrooms. Generally, there is a plumbing “trap” (shaped like a U or P) that has water in it to block smells from rising. These however, can dry out leaving a transmission route for disease. Drying out can occur from non-use or air pressure surges. The ethane tracer gas presence indicates that these traps dried out. Contact tracing and other standard causal patterns did not reveal leads. One team member on Kang’s study indicated that there could also be three other outbreak incidents related to waste vent gases. However, while compelling, there is no iron clad evidence and it is possible the disease was contracted elsewhere. Mechanical bathroom exhaust fans and outdoor air conditions can lead to a favorable environment for SARS-Cov-2 to spread through bathroom exhaust. There should be appropriate caution reading these findings. Many factors must fall into place for this kind of residential transmission. For instance, the proposed transmission route relies on viral infectivity in fecal droplets and aerosols. However, building wastewater systems are a potential reservoir for many other viruses and bacteria, even in the absence of SARS-CoV-2.
SARS-Cov-2 in toilets
Virus-containing fecal aerosols can be produced during toilet flushing after index patient use. These bioaerosols can settle onto surfaces and remain infective. There was a case where a South Korean woman most likely contracted Covid-19 from an airplane toilet. She self-quarantined in complete isolation for three weeks before the flight, did not use public transport to get to the airport, wore an N-95 mask for the entire flight except a visit to the bathroom, all passengers sat two meters (six feet) from each other during boarding, and quarantined for two weeks by South Korean officials on landing. The one asymptomatic sick passenger on the plane used the toilet before her. The most likely transmission route was encountering contaminate surfaces because the airplane used high-efficiency particulate arresting systems. According to Dr. Joseph Allen from Harvard’s T.H. Chan School of Public Health, about 1,000,000 additional particles per air cubic meter are generated when a toilet is flushed with the lid up. These particles can settle on surfaces or linger in the air until someone breaths them in.
Protecting yourself
There are some easy common-sense protective measures you can take to protect yourself. Ensure bathrooms you use are well ventilated, turn on an exhaust fan when entering a bathroom and leave it on when you leave. Make sure the P or U trap isn’t dried out; a bad smell indicates a dry trap. Close the lid when flushing the toilet to help prevent bioaerosols from spreading. Clean and disinfect bathroom surfaces. Most importantly, wash your hands when leaving the bathroom, then try and use a paper towel to touch surfaces including the door handle on your way out.
Potential WBE Advances
To date SARS-Cov-2 Wastewater Based Epidemiology (WBE) relies on the same analytical platforms used in clinical diagnostic testing (eg PCR or antigen testing). WBE does not need to be limited to the monitoring the infectious agent’s nucleic acid or antigens. WBE could target endogenous biomarkers that are significantly elevated in diseased states. This could reduce analytical costs and broaden availability (through immunoassays) or better serving as leading infection indicators (earlier alerts). Urine (as opposed to fecal) biomarkers would also simplify sampling and sample preparation. Since Covid-19 can cause extensive inflammatory damage, biomarker for systemic oxidative stress such as the prostaglandin-like class of substances called isoprostanes are currently being proposed. These biomarkers may be more universally excreted among infected individuals, better track the infection severity, have tighter per-capita excretion ranges (allowing for better case count calibration and estimation), and avoiding a potential under-appreciated problem with using PCR, where RNA fragments may not be originating from viable virus, but rather from virus remnants (litter) from cleared infections. That last issue could overestimate infection incidence or intensity. It is also speculated that patient repeat infection reports are caused by this.
WBE could also be used to test hypotheses involving correlating various community-wide population demographics with the magnitude and duration of SARS-CoV-2 measurements to probe inter-community disparities such as race, culture, income, healthcare availability, and occupation. WBE data could also be examined for correlations with drug manufacturer geographic prescribing data — notably for drugs suspected to improve or exacerbate Covid-19 therapeutic outcomes. WBE could also determine which SARS-CoV-2 subtypes dominate in given populations.
WBE Other Shortcomings
In addition to the difficulties I outlined in my first article on WBE, I have learned about some additional difficulties. Population size estimations are difficult because populations fluctuate due to travel and commuters. The standard approach to this is to measure certain endogenous biomarkers such as cortisol or cotinine then calculate those as daily loads normalized to population sizes. However, some unique population fluctuations have negligible catchment impacts leading to higher uncertainties in smaller populations. Other standard population estimating wastewater parameters used such as Chemical Oxygen Demand, Biochemical Oxygen Demand, or ammonia can reduce uncertainties but can be strongly influenced by the wastewater’s composition. Another is that biomarkers must be relatively stable not only in the sewer system but also through the sampling and storage processes.
Another shortcoming is wastewater itself makes it extremely difficult to extract and quantify biomarkers and chemicals. PCR inhibitors include fats and proteins, as well as humic and fulvic acids. New digital PCR techniques use Poisson distributions, via partitioning samples into reaction wells to lessen these effects.
Previously Unmentioned Successes
WBE can distinguish differences between prescription and consumption of a pharmaceutical. Investigating parent compounds to metabolites ratios or ratios between compound enantiomers in wastewater can distinguish human excretion from direct pharmaceutical disposal in sewers. This distinction ability is important because prescriptions do not necessarily correlate to use. Delayed prescribing is a strategy where doctors prescriptions available but ask patients to delay using them to see if symptoms improve. These initiative successfully reduced antibiotic use in New Zealand, Norway and England; WBE can distinguish how many antibiotics were actually used as opposed to prescribed.
WBE can minimize the tests required to uncover positive cases. Clinical tests need to continually increase test coverage. The ratio between tests required to uncover a single case and total tests is generally the most direct infection extent indicator. A low ratio (when using random sampling) points to a high incidence of infection and therefore the need for more intensive testing until the ratio significantly increases (where increasing testing amounts are required to confirm additional cases). This indicates increasing success in containment or mitigation measures. However, diagnostic tests are never intended for mass surveillance. The tests are generally time-consuming and costly as well as exposing the test administrator. There are two alternatives: increase conventional testing or minimize the tests required to reveal positive cases. Pooled testing procedures increases testing capacity and throughput, especially for PCRs. Pre-targeting subpopulations can help with minimizing the rests required as well. These methods conserve diagnostic tests. Using WBE then can be akin to using a forward observer to improve artillery’s accuracy. This would greatly reduce the demand for diagnostic testing and reduce supply-chain shortages caused by insufficient manufacturing capacity. The metric of success for WBE when used for targeting the use of clinical diagnostic testing would be lower ratios for “Tests Administered” per “Case Confirmed” (counter intuitively, maximize the positivity test rate).
WBE may also be the only way to infer the uninfected population as well as provide perspective on how well diagnostic testing reflects the total population.
You can probably catch Covid-19 from public toilets and in star-crossed circumstances from your neighbor’s toilet. WBE research is developing but remains much more difficult than analyzing for chemicals such as illegal drugs because there are differences in viral shedding patterns, total shedding, viral attenuation during sewer travel, and determining statistically representative sampling. Even in other applications, matrix separations pose difficulties for WBE. WBE is still an effective epidemiology tool to rapidly monitor disease spread and trends, especially when paired with other contemporary measures. The preponderance of evidence suggests that CoVs are less stable in the environment than other enteric viruses. Water recycling guidelines may have to be revised in light of emergent diseases and viral shedding into sewer systems. Effective surveillance systems are key for the rapid intervention and infectious disease control. WBE is the most effective and cheap near real-time tool available to communities.
Chan, K. H., Poon, L. L., Cheng, V. C. C., Guan, Y., Hung, I. F. N., Kong, J., … & Peiris, J. S. M. (2004). Detection of SARS coronavirus in patients with suspected SARS. Emerging infectious diseases, 10(2), 294.
Cha, S., & Smith, J. (2020). Explainer: South Korean findings suggest ‘reinfected’ coronavirus cases are false positives. Reuters.
Cheung, K. S., Hung, I. F., Chan, P. P., Lung, K. C., Tso, E., Liu, R., … & Yip, C. C. (2020). Gastrointestinal manifestations of SARS-CoV-2 infection and virus load in fecal samples from the Hong Kong cohort and systematic review and meta-analysis. Gastroenterology. https://doi.org/10.1053/j.gastro.2020.03.065
Foladori, P., Cutrupi, F., Segata, N., Manara, S., Pinto, F., Malpei, F., … & La Rosa, G. (2020). SARS-CoV-2 from faeces to wastewater treatment: What do we know? A review. Science of the Total Environment, 743, 140444. https://doi.org/10.1016/j.scitotenv.2020.140444
Gundy, P. M., Gerba, C. P., & Pepper, I. L. (2009). Survival of coronaviruses in water and wastewater. Food and Environmental Virology, 1(1), 10.
Heller, L., Mota, C. R., & Greco, D. B. (2020). COVID-19 faecal-oral transmission: Are we asking the right questions?. Science of The Total Environment, 138919.
Hovi, T., Shulman, L. M., Van Der Avoort, H., Deshpande, J., Roivainen, M., & De Gourville, E. M. (2012). Role of environmental poliovirus surveillance in global polio eradication and beyond. Epidemiology & Infection, 140(1), 1-13.
Kaiser, Jocelyn (2020) Can you catch COVID-19 from your neighbor’s toilet? Science Magazine
O’Brien, J. W., Choi, P. M., Li, J., Thai, P. K., Jiang, G., Tscharke, B. J., … & Thomas, K. V. (2019). Evaluating the stability of three oxidative stress biomarkers under sewer conditions and potential impact for use in wastewater-based epidemiology. Water research, 166, 115068.
Petrie, B., Youdan, J., Barden, R., & Kasprzyk-Hordern, B. (2016). New framework to diagnose the direct disposal of prescribed drugs in wastewater–a case study of the antidepressant fluoxetine. Environmental Science & Technology, 50(7), 3781-3789.
Wolfel, R., Corman, V. M., Guggemos, W., Seilmaier, M., Zange, S., Müller, M. A., … & Hoelscher, M. (2020). Virological assessment of hospitalized cases of coronavirus disease 2019. Nature. https://doi. org/10.1038/s41586-020-2196-x.
Wu, Y., Guo, C., Tang, L., Hong, Z., Zhou, J., Dong, X., … & Kuang, L. (2020). Prolonged presence of SARS-CoV-2 viral RNA in faecal samples. The lancet Gastroenterology & hepatology, 5(5), 434-435. https://doi.org/10.1016/S2468-1253(20)30083-2
A thorough look at the EPA’s perchlorate final action
99.3% pure potassium perchlorate containing a small amount of cabosil to minimize clumping and keep the mixture free-flowing. This is typical of fireworks; courtesy of https://fireworkscookbook.com/
The EPA recently declined to regulate perchlorate under the Safe Drinking Water Act (SDWA) and promulgated this press release. The Federal Register Final Action Notice is here (RIN:2040-AF28). In general, this decision has been heavily criticized; for instance, a New York Times’ headline read “E.P.A. Won’t Regulate Toxic Compound Linked to Fetal Brain Damage.” The ranking Senate Environment and Public Works Committee member, Senator Tom Carper (D-DE) even said “ [the] EPA has abdicated its responsibility to set federal drinking water standards for a chemical long known to be unsafe, instead leaving it up to states to decide whether or not to protect people from it.” It begs the question why would an agency charged to protect human and environmental health decline to regulate a known hazard? Perhaps more surprisingly, the nation’s water safety and utility advocate, the American Water Works Association (AWWA) agreed with the EPA’s ruling. This article will examine what perchlorate is, what it means to be regulated under the SDWA, perchlorate’s regulatory history, and what the EPA, as well as advocates and critics had to say about the recent ruling. As this is slightly longer than a typical article each section is meant to be relatively self-contained.
What is Perchlorate?
Perchlorates are chemical compounds containing ClO4–. The most common commercial perchlorates are ammonium perchlorate (NH4ClO4), perchloric acid (HClO4), potassium perchlorate (KClO4), sodium perchlorate (NaClO4), and lithium perchlorate (LiClO4). The perchlorate anion may also be bound to other alkali or alkaline earth metals. Perchloric Acid (HClO4) is stronger than sulfuric and nitric acids and is the most common precursor for other perchlorates. Perchlorates can form naturally in the atmosphere leading to trace amounts in precipitation; especially in west Texas, New Mexico, and Northern Chile in the Atacama Desert. Perchlorate is often used as solid-state rocket fuel and is also used in fireworks, flares, gunpowder, and explosives. Surprisingly, given its highly reactive nature, perchlorate can persist in the environment for years. By far the most manufactured perchlorate is ammonium perchlorate for its use in aerospace and defense; it is manufactured more by mass than all other perchlorates combined.
Perchlorate’s uses
The space shuttle’s booster rocket was about 70% ammonium perchlorate and the rest was powdered aluminum or elastomeric binders. Ammonium perchlorate was also responsible for the PEPCON disaster on 4 May 1988 which caused 2 fatalities, 372 injuries, and about $100 million 1988 dollars damage ($218 million in 2020 dollars). The disaster’s damage radius was approximately 10 miles (16 km) and equivalent to about one TNT kiloton or the same yield as a small tactical nuclear weapon. The blast was caught on video by Dennis Todd and has been used in many TV shows. It can be viewed here.
Perchlorates’ use in rocket fuel extends to military applications. Most submarine launched intercontinental ballistic missiles use ammonium perchlorate boosters; because of this many countries, including the US, consider exact perchlorate production, import, and export figures confidential or a state secret. However in 2008, the Department of Defense did publish an estimated use between 6 and 8 million perchlorate pounds annually.
Perchlorate is also used in temporary adhesives, electrolysis baths, batteries, air bag ignitors, matches, desiccants (drying agents), etching agents, electropolishing, ion-exchange chromatography, oxygen candles (used on submarines and in spacecraft), cleaning agents, and oxygen generating systems. Much like the rat poison Warfarin, perchlorates are sometimes used in medical applications. Perchlorate is used to treat overactive thyroids and to counter the drug amiodarone’s side effects. Additionally, perchlorate is used to block radioactive technetium uptake during medical imaging of the brain, blood, and placenta.
Perchlorate in Agriculture
Chilean nitrate fertilizer contained high natural perchlorate levels (0.12-0.26% by weight) and perchlorate is found where this was used; especially on Long Island, New York. Studies have also uncovered perchlorates in synthetic fertilizers in concentrations from 1,800 μg/g to 4,200 μg/g. Likewise, perchlorates have been used in weed killers and leguminous plant growth promoters. Perchlorates have also been used to increase poultry and other farm animal’s weights although there is no evidence perchlorates increase human weight.
Perchlorate, Mars, and Space Travel
Magnesium perchlorate (Mg(ClO4)2) is manufactured in smaller amounts than other perchlorates however, it has been found on Mars in large quantities (>0.6% by weight in soil). Magnesium perchlorate forms the basis for several theories that liquid water can be found on Mars at or below the surface because it has a high solubility (99.3 g/100 mL) and freezing point depression/boiling point elevation falls into colligative properties. A colligative property depends on the quantity of solutes in a solvent rather than the solute’s specific chemical nature. Magnesium perchlorate’s presence on Mars has also led to theories that Mars could be a natural rocket refueling station. Unfortunately, 0.6% by weight in soil is equivalent to 6×10⁶ ppb and would be exceedingly toxic to human settlement.
Where is perchlorate found?
Perchlorates were identified in about 5% of community water systems in the US based on 1997 and 1998 American Water Works Association led studies performed on the EPA’s behalf. A community water system is a water system that serves at least 25 people or 15 service connections; there are about 52,110 community water systems in the United States as of 7 April 2014 according to the CDC. The studies were performed before Standard Method 314.0 was adopted by the EPA and indicated a need for analytical refinements. The Environmental Working Group, a nonprofit environmental activist group that is often labeled as alarmist, suggests that perchlorate was detected in 375 water utilities serving 12.1 million Americans in its Tap Water Database. During EPA mandated tests in 2001 and 2003 under the 1st Unregulated Contaminant Monitoring Rule (UCMR1) perchlorate was found in drinking water systems serving 16.6 million Americans.
As perchlorate is highly soluble, relatively stable, and highly mobile in water and has a low vapor pressure, perchlorates do not volatilize from water or soil to air, leach readily into groundwater, and travel large distances from initial contamination. Perchlorate is only weakly absorbed so its movement through soil is generally un-retarded. These two properties indicate that perchlorate travels rapidly and far in water. For instance, the Olin Flare Facility in Morgan Hill California created a plum which stretched more than 10 miles (16 km). You can read more about the Olin Flare Facility here.
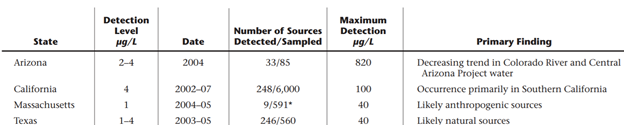
In addition to the UCMR1 studies, Arizona, California, and Texas each completed their own state-based studies summarized in the table below. Texas’ study is particularly interesting because no credible anthropogenic perchlorate source could explain the contamination’s scale or level leading Texas Tech researchers to propose natural contamination.
State based supplements to UCMR1 summay
The AWWA, EPA, and ATSDR (Agency for Toxic Substances and Disease Registry) all agree that perchlorate is not widely dispersed to the environment by rocket combustion. When it is used as a fuel perchlorate is destroyed in the combustion process. Most environmental releases come from anthropogenic releases (manufacturing accidents), fireworks, fertilizer application, and natural formation.
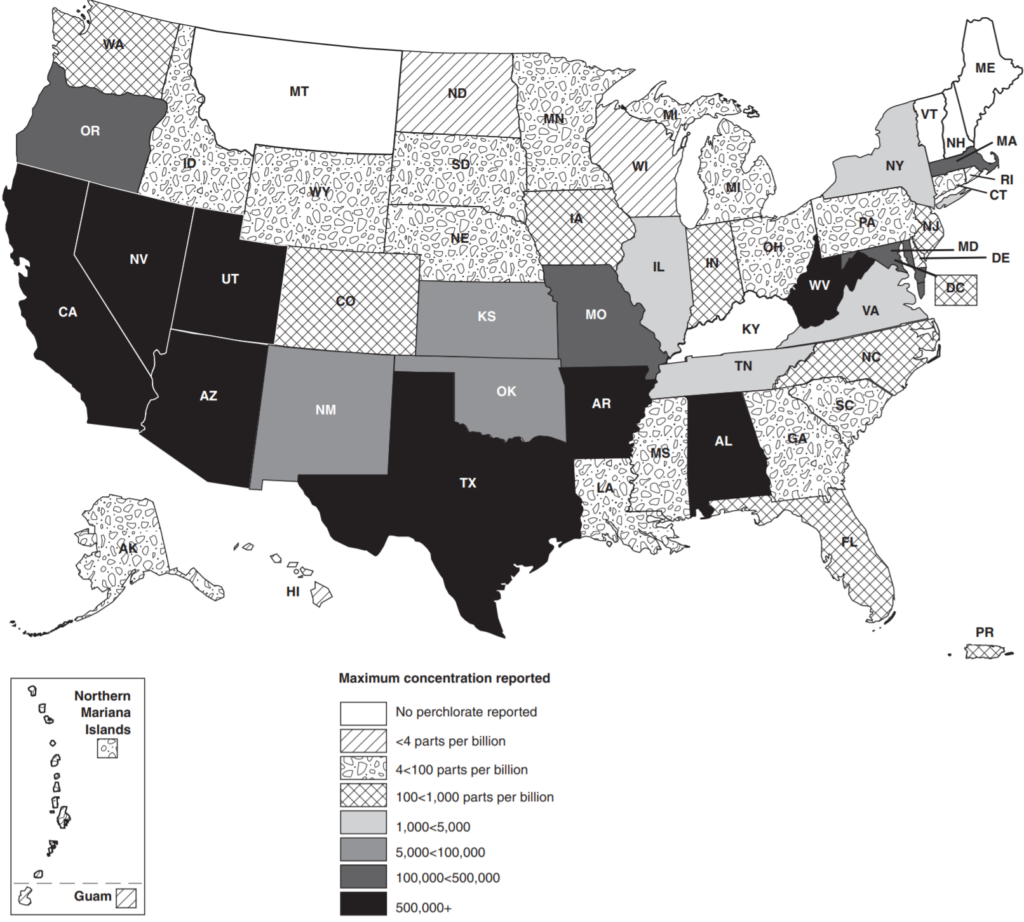
Perchlorate has been detected in most states, the District of Columbia, Puerto Rico, and the Mariana Islands. A contamination map from this 2010 Government Accountability Office (GAO) report is given below.
Perchlorate contamination map from this 2010 GAO report
Surprisingly, potassium perchlorate is also an FDA approved additive in food container rubber gaskets, not to exceed 1% under 21 CFR 177.1210(b)(5). There are perchlorate contamination indications in food. Leafy plants such as tobacco and lettuce and highly vascular plants such as tomatoes have been shown to uptake perchlorate in significant concentrations (upto 164.6 mg/kg dry weight in green flue-cured tobacco). Perchlorates are also found in household bleach that is stored for long times.
Perchlorates health effects
Perchlorates mainly exhibit thyroid toxicity in humans. Perchlorates also partially inhibit thyroidal iodine uptake leading to one medical application for them. Perchlorates are conjectured to lead to hypothyroidism and goiter although this remains unproven. While unproven, perchlorates were used to treat hyperthyroidism for many years leading credence to the suspicion. Side effects from perchlorate treatment included skin rashes, nausea, and vomiting. Some patients developed severe red-blood cell shortages leading to death (fatal aplastic anemia). It is speculated that perchlorate effect depends on gender, exposure length, and dietary iodine consumption.
Perchlorate hurts the thyroid by inhibiting iodine’s transport into thyroid follicle cells by competitive binding to sodium/iodine symporter which catalyzes Na+ and I–‘s transfer. Perchlorate’s inhibition limits iodine levels needed to produce thyroxine (T4) and triiodothyronine (T3). Perchlorate is considered an endocrine disrupting compound because it effects T4 and T3. While perchlorate’s effects are reversible, development problems caused by inadequate circulating hormones are not; leading to conjectured child brain developmental effects and the New York Times’ headline at this article’s start.
Perchlorate was shown to significantly increase systolic blood pressure (the top number in blood pressure readings) which is the maximal arterial pressure when the heart beats. Differences in systolic and diastolic (the bottom number in blood pressure readings or the arterial pressure between beats) are known as pulse pressures. A normal pulse pressure is about 40 mm Hg or less; pulse pressures 60 or greater are considered risk factors for cardiovascular disease, stroke, and heart attacks.
There is some indication that perchlorate may have pulmonary toxicity such as inflammatory infiltrates, alveolar collapse, subpleural thickening, and lymphocyte proliferation.
Perchlorate’s Carcinogenicity
Perchlorates are not considered to be carcinogens by the Department of Health and Human Services or the International Agency for Research on Cancer. It is also conjectured that perchlorate may cause changes in children’s brain development.
The Safe Drinking Water Act (SDWA)
The SDWA, Public Health Services Act Title XIV, is the major federal law protecting drinking water and was first enacted in 1974 with major revisions in 1986 and 1996. The original 1974 act established a system where states, once vetted, are responsible for the SDWA’s implementation and enforcement; this is known as primacy. Primacy may also be granted to Indian Tribes, Territories, and the District of Columbia. In cases where primacy has not been granted to a state, tribe, territory, or district the EPA retains primacy. The EPA has primacy in every Indian tribe except the Navajo Nation, in Wyoming, and the District of Columbia. In every case where primacy was requested it has been granted. To request primacy local regulations at least as stringent as national requirements must be adopted, adequate enforcement procedures must be developed (including monitoring and inspections), and administrative penalty authority must be adopted. Primacy agencies must also conduct water system inventories, maintain records and compliance data, and make reports as EPA may require as well as developing safe water provision emergency plans. Although the SDWA is the major federal law, other laws including the Clean Water Act and various Water Infrastructure Improvement Acts also modify drinking water protection. The SDWA applies to the approximately 152,700 American water systems which supply water to at least 25 people or 15 service connections.
Monitoring Requirements under the SDWA
Primacy agencies may follow the Standardized Monitoring Framework (SMF) or the Alternative Monitoring Guidelines. The SMF was meant to simplify, standardize, and consolidate drinking water monitoring requirements. The SMF was established 30 January 1991 and included 9-year fixed compliance cycles each subset into three periods. The Alternative Monitoring Guidelines allow primacy agencies to grant utilities: monitoring waivers, surrogate sampling and reduced nitrate monitoring.
Under the SMF community water systems serving >10,000 would collect 4 quarterly perchlorate samples during the second compliance period of the fourth compliance cycle (January 1, 2023 through December 31, 2025). Community water systems serving 10,000 or fewer people and non-transient noncommunity water systems would collect 4 quarterly samples during the third compliance period of the fourth compliance cycle (January 1, 2026 through December 31, 2028). The EPA estimated that 60% of surface water systems and 10% of groundwater systems would be ineligible for waivers to reduce monitoring requirements.
SDWA Amendments
The first major SDWA amendments in 1986 were mainly designed to speed the EPA’s contaminant regulation and groundwater protection. The 1986 amendments were extremely ambitious and attempted to make up for lost time since the original act. The 1996 amendments recognized the 1986 amendments were too aspirational and slowed down the required contaminant regulation pace as well as overhauling the entire regulation process. The 1996 amendments gave us the current risk-based regulatory approach used today. Additionally, the 1996 amendments created state-based operator certification programs.
Chemical Regulation under the SDWA
The 1996 SDWA amendments established three requirements for a chemical to be regulated under the Safe Drinking Water Act (SDWA):
The substance must have an adverse health effect
It must occur or have a substantial likelihood to occur at adverse public health frequencies and levels
The EPA’s Administrator must judge regulation to present a meaningful opportunity for health risk reduction
Once the EPA Administrator determines to regulate a contaminant the EPA must propose a rule within 24 months and promulgate a National Primary Drinking Water Regulation (NPDWR) within 18 months after proposal. New regulations generally become effective three years after promulgation and up to two additional years may be provided if capital improvements are needed. Systems serving 3,300 or fewer people may be given an additional 9 years beyond the compliance deadline. The EPA must review and strengthen as appropriate each drinking water regulation every six years. When developing regulations, EPA is required to use the best available, peer reviewed science, supporting studies and data as well as make publicly available a risk assessment document that discusses estimated risks, uncertainties, and studies used in the assessment.
The Unregulated Contaminant Monitoring Rule (UCMR)
The 1996 SDWA amendments also created the Unregulated Contaminant Monitoring Rules. Every 5 years the EPA must publish an unregulated contaminant candidate list (CCL) for chemicals which are known or anticipated to both occur and cause deleterious health effects in public water systems. Additionally, every 5 years the EPA must publish a 30 contaminant or less list that requires a monitoring program by public water systems known as the Unregulated Contaminant Monitoring Rule (UCMR). CCLs and UCMRs are required on a quinquennium basis and are given sequential numbers to refer to the different lists; for example the Third Unregulated Contaminant Monitoring Rule (UCMR3) was published on 2 May 2012 and UCMR4 was published on 20 December 2016. Every 5 years, the EPA is required to make a regulator determination (whether to regulate) for at least 5 of the 30 chemicals under the CCL. Generally, UCMR monitoring is from all public water systems serving more than 10,000 people and 800 representative public water systems serving 10,000 or fewer people. Perchlorate was the first drinking water contaminant that EPA has proposed to regulate in nearly 24 years under the provisions of the Safe Drinking Water Act Amendments of 1996.
Maximum Contaminant Levels (MCL) and a Maximum Contaminant Level Goals (MCLG)
A maximum contaminant level (MCL) is a legally enforceable regulation under the Safe Drinking Water Act. A maximum contaminant level goal (MCLG) is an aspirational non-enforceable public health objective rather than a regulatory standard. For non-carcinogens the MCLG is based on the reference dose. The reference dose essentially is a conservative estimate of the daily allowable contaminant consumption a person can have without an expected adverse health effect during a typical lifetime. As the US adheres to a linear no threshold radiation policy, the MCLG for carcinogens is always zero. MCLs and MCLGs often coincide however, they do not always. Since MCLs are legally enforceable they may not match MCLGs because of difficulties in contaminant measurement, lacking treatment technologies, or treatment cost outweighing public health benefits. MCLs must be set as close as “feasible” using best available technology, treatment techniques, or other means (considering costs) to the MCLG. The EPA may ignore the feasible level if the feasible level could lead to an increase in health risk by increasing other contaminant’s concentration or interfering with treatment processes used to comply with other SDWA requirements. In such cases the overall health risk must be minimized.
For contaminants the EPA wants to regulate but there is no economical or technically viable threshold (MCL), the EPA creates “treatment technique rules” such as the Lead and Copper Rule which are enforceable procedures to minimize risk.
SDWA Cost Benefit Analysis
Criteria three for regulating a contaminant under the SDWA in the 1996 amendments, the EPA Administrator’s judgement to present meaningful health risk reduction, comes with it a required cost-benefit analysis. EPA must publish a “health risk reduction and cost analysis.” For each drinking water standard and each alternative standard being considered, EPA must publish and take comments on quantifiable and nonquantifiable health risk reduction benefits and costs. EPA may promulgate an interim standard without first preparing a health risk reduction and cost analysis or determination whether a regulation’s benefits justify the costs if the Administrator believes that a contaminant presents an urgent public health threat.
If the EPA Administrator determines that the benefits do not justify the costs, the EPA may promulgate a standard that maximizes health risk reduction benefit at a justifiable cost provided by the benefits. The EPA generally has set standards based on technologies affordable for large communities however, P.L. 104-182 requires the EPA to list any technologies or procedures that are affordable for small public water systems serving populations of 10,000 or fewer. If EPA does not identify “compliance” technologies that are affordable for small systems, then the agency must identify small system “variance” technologies or other means that may not achieve the MCL but are protective of public health. The SDWA allows for variances and exceptions based on costs.
Perchlorate Regulation
As of 11 August 2020, drinking water perchlorate is regulated in Arizona, California, Massachusetts, New Jersey, New York, and Texas. In addition, Illinois, Maryland, Nevada, New Mexico, and Wisconsin have advisory levels. The Government Accountability Office states that 10 states have established advisory or health-based perchlorate goals. Perchlorates can be classified as a D001 Resource Conservation and Recovery Act (RCRA) hazardous wastes under 40 CFR 261.23 based on perchlorate’s reactivity characteristic depending on specific circumstances. The EPA has also established a 55 mg/kg residential soil screening level (SSL) and a 720 industrial SSL under Superfund. The Department of Transportation regulates perchlorates under its 49 CFR 172.101 hazardous material table. Various states also list perchlorate as a hazardous substance such as Rhode Island and Pennsylvania.
Perchlorate’s Regulatory history
In 1995, the EPA established a provisional 4 – 18 ppb provisional reference dose range.
In 1997, the EPA first discovered perchlorate contamination in Nevada. At that time, 1,000 pounds (454 kg) per day of perchlorate entered Lake Mead and the Colorado River through contaminated groundwater. Lake Mead provides drinking water to residents of southern Nevada. The contamination originated from the only two perchlorate-manufacturing facilities in the United States at the time.
In August 1997, the Nevada Division of Environmental Protection selected 18 parts per billion (ppb) as the recommended action level for cleanup pending a more current risk assessment. Likewise, California’s Department of Public Health selected 18 ppb action level based on the EPA’s 1995 provisional reference dose range.
In 1998, the EPA published its first draft perchlorate assessment and perchlorate was added to the EPA’s first Contaminant Candidate List (CCL1) indicating that the EPA might be interested in regulating perchlorate. In 1999 perchlorate was included on the EPA’s first Unregulated Contaminant Monitoring Rule (UCMR1). Perchlorate was rolled over into CCL2 in 2005 along with 50 other CCL1 contaminants because the EPA was waiting on monitoring results and health effect studies. Without a regulatory determination perchlorate was rolled into a draft CCL3 in 2008.
In January 2002, the EPA revised its draft assessment with a 1 ppb reference dose (RfD); this assessment was widely criticized although it did cause California to lower its action level to 4 ppb. California selected 4 ppb as that was the 1995 EPA’s lower provisional reference dose range and the lowest level that the era’s analytical methods could detect. After a second peer review which was also not well received by the scientific community, The Department of Defense, The National Aeronautics and Space Administration, The Department of Energy, and the EPA asked the National Academy of Sciences to provide an assessment which it rendered in January 2005 recommending a 0.0007 mg/(kg * day) RfD.
In 2001, perchlorate was detected in Massachusetts’ Military Reservation’s (MMR) groundwater at 600 ppb. The site was investigated from the 1980s when groundwater contamination was first discovered. In 1996 in response to the contamination discovered in Cape Cod’s Aquifer the first of four EPA SDWA administrative orders was issued forcing the Impact Area Ground Water Study Program’s creation. Cape Cod’s aquifer has 6 lenses: Sagamore, Monomoy, Nauset, Chequesset, Pamet, and Pilgram. MMR is situated directly on top of Cape Cod’s aquifer’s most productive part: the Sagamore Lens. About 450 million gallons per day (MGD) flow through Cape Cod’s aquifer with nearly 60% of water flux due to the Sagamore Lens. The Sagamore Lens is the only drinking water source for Cape Cod’s 200,000 year-round and 500,000 seasonal residents. In 1997 the second administrative order was issued; this order mandated that the Army stop all training at MMR. I cannot understate how far reaching this was for the Army. In the “pre-war era” then the Army existed primarily to train. Stopping that main function was akin to ordering Coca-Cola to stop producing soft drinks. That order was the primary driving force behind the Department of Defense’s extensive perchlorate response. The Bourne Water District Officially requested state guidance in March 2002. Massachusetts officially recommended that Bourne should set a 1 ppb limit based on the EPA draft assessment. In 2003, the Massachusetts Department of Environmental Protection established a scientific advisory committee. In February 2004 the committee recommended, and Massachusetts adopted, a 1 ppb advisory level which was below the 4 ppb detection limit available at the time.
In 2003, a federal court in California found that Superfund applied because perchlorate is ignitable and a characteristic hazardous waste. California’s legislature enacted AB 826, the Perchlorate Contamination Prevention Act of 2003, requiring California’s Department of Toxic Substances Control (DTSC) to adopt regulations specifying best management practices for perchlorate and perchlorate-containing substances.
In March 2004, the California EPA Office of Environmental Health Hazard Assessment (OEHHA) set a 6 ppb Public Health Goal (PHG). A PHG is the contaminant level in drinking water that does not pose a significant risk to health. Unlike EPA’s Drinking Water Equivalent Level, OEHHA’s PHG level accounts for exposures to a contaminant from sources besides drinking water. It was not a regulatory requirement. Interestingly, the EPA and the University of California peer reviewed this document even though the EPA had initially suggested a lower reference dose from only water sources.
On 18 February 2005 the EPA set a 0.0007 mg/(kg * day) reference dose (RfD) for perchlorate consistent with the January 2005 National Academy of Sciences report. A (RfD) is a scientific estimate of a daily exposure level that is not expected to cause adverse health effects in humans with a 10 fold conservative uncertainty factor (meaning the level expected to not cause adverse health effects in health humans (No Observed Effect Level – NOEL) is actually 0.007 mg/(kg * day); the 10 fold uncertainty is to cover scientific error such as variability across life-stages, individuals, or genders and protect sensitive sub-groups such as fetuses). EPA’s RfD translated to a 24.5 ppb Drinking Water Equivalent Level (DWEL). In dilute water a part per billion is equivalent to a microgram per liter μg/L. A Drinking Water Equivalent Level, which assumes that all contamination comes from drinking water and is the contaminant concentration an average citizen will have no adverse effect with a margin of safety. Exposures above the DWEL are not necessarily considered unsafe because of the built-in safety margin. EPA’s Superfund cleanup program issued 24.5 ppb cleanup guidance based on the RfD.
In July 2006 Massachusetts became the first state to adopt a regulatory standard when it promulgated a 2 ppb perchlorate state drinking water standard. To arrive at a drinking water standard, the department considered information on the availability and feasibility of testing and treatment technologies, as well as data that demonstrated that perchlorate can enter drinking water as a by-product of hypochlorite (bleach) solutions used as disinfectants. The department chose to set the standard at a level that did not create disincentives for public water systems to disinfect their water supplies. The department determined that a maximum contaminant level of 2 parts per billion would provide the best overall protection of public health, considering the benefits of disinfection, while retaining a margin of safety to account for uncertainties in the available data.
In October 2007, California promulgated a 6 ppb regulatory standard. By law, the California Department of Public Health is required to set a drinking water standard as close to the public health goal as is economically and technologically feasible. California found that large water systems could meet the standard with $18 per customer annual costs while annual costs for smaller systems ranged from $300 to $1,580. The Department of Public Health proposed economic based variances for systems serving less than 10,000 customers if the estimated annual treatment cost per household exceeds 1% of the median household income in the community served.
On 10 October 2008, under President George W. Bush and EPA Administrator Marcus Peacock, the EPA published a preliminary determination not to regulate perchlorate. Administrator Peacock found that there was no meaningful opportunity for health risk reduction.
In April 2010 the EPA’s Office of the Inspector General released a report critiquing the risk assessment process and procedures used by the EPA to develop and derive the perchlorate RfD.
On 11 February 2011, under President Barrack Obama and EPA Administrator Lisa Jackson, the EPA reversed this decision and decided to regulate perchlorate however, it provided no specific regulatory proposals. This decision caused me personally much consternation as I was writing my bachelor’s thesis on modeling perchlorate in groundwater using the Complex Variable Boundary Element Method and forced me to re-write several sections just before it was due!
In September 2012 the US Chamber of Commerce submitted a request for correction under the Information Quality Act regarding the regulatory decision. The EPA formed a Scientific Advisory Board that recommended many changes to the data under the decision. The Scientific Advisory Board recommended that the EPA abandon the standard RfD based MCL approach in favor of physiologically based pharmacokinetic/pharmacodynamic modeling based on mode of action. The EPA accepted and followed this advice.
On 18 February 2016, the National Defense Resource Council (NDRC), filed a complaint against the EPA essentially saying the EPA was failing in its mandate because the EPA had not yet proposed a perchlorate limit. The NDRC is a non-profit environmental advocacy group which started as a Scenic Hudson Preservation Conference outgrowth; oddly enough this group was created to block Consolidated Edison plans for a powerplant on Storm King Mountain right by West Point, New York.
On 18 October 2016 the NDRC and EPA reached consent degree in which the EPA did not admit to failing to comply with statutory obligations. The EPA entered the consent decree to prevent judicial interference with the remedial plan that it preferred. The EPA also expressly reserved all discretion under the SDWA and general administrative law principles. Basically, the NDRC simply wanted the EPA to hurry up and propose specific limits. Its important to note that the EPA could NOT have promised the NDRC any specific regulatory changes because that would violate the Administrative Procedures Act (APA). Agencies may agree to consider rule-making changes and to adopt regulations required by law, but they generally will not make substantive commitments concerning the content of regulations that are subject to APA requirements. The consent decree required the EPA to issue national drinking water regulation for perchlorate by 19 December 2019. The EPA asked, and the NDRC agreed, to extend the deadline until 19 June 2020.
On 23 May 2020 EPA Administrator Andrew R. Wheeler signed a proposed rule issued on 26 June 2019 setting a maximum contaminant level (MCL) coincidental with a maximum contaminant level goal (MCLG) of 56 micrograms per liter (μg/L). Alternatives included in the proposal were 18 μg/L or 90 μg/L MCLs coinciding with MCLGs, establishing an MCLG of 18, 56, or 90 with a National Drinking Water Standard, and withdrawing its 2011 decision to regulate perchlorate.
On 18 June 2020, after the public comment period, the EPA issued a press release about the final action declining to regulate perchlorate under the Safe Drinking Water Act. The NDRC was given until 9 July 2020 to challenge the scientific footing the EPA used; which it did. On 21 July 2020, the EPA published this final action. It is likely that the NDRC will sue the EPA to try and force a different outcome.
The EPA’s Stated Opinion
On 18 June 2020, the EPA issued a press release about the final action declining to regulate perchlorate under the Safe Drinking Water Act. On 21 July 2020, the EPA published this final action. EPA Administrator Andrew Wheeler said “State and local water systems are effectively and efficiently managing levels of perchlorate. Our state partners deserve credit for their leadership on protecting public health in their communities, not unnecessary federal intervention.” The EPA cited three main criteria for declining to regulate perchlorate:
Californian and Massachusetts’ state level regulation of perchlorate (these two states constituted about 60% of what would have been exceedances in the new rule; the exceedances were based on the old UCMR1 monitoring campaign updated with current conditions from Massachusetts and California)
Current remediation efforts to address perchlorate contamination especially in Nevada contaminating the Colorado River and Lake Meade as well as overall decreasing perchlorate levels
Improved storage and handling procedures for drinking water disinfectants
Oddly enough, in the actual final regulatory action the third criteria cited was not mentioned. Improved bleach storage and handling only appeared in the press release.
The EPA’s analysis found that nationwide perchlorate regulation costs would significantly outweigh benefits and decided to focus its limited resources on more immediate and significant public health concerns. The EPA also cited historical precedent. By the EPA’s analysis the pesticide Aldrin (a DDT component) would have affected more water systems than perchlorate does, and the EPA declined to regulate Aldrin in 2003. The EPA also estimated that implementing a perchlorate regulation would cost $9.5-18M while the benefits only ranged from $0.3-3.7M. The EPA argued that perchlorate’s infrequent occurrence at concerning levels imposes high monitoring and administrative cost burdens on states and public water systems without rendering net tangible benefits.
The EPA wrote: “It is of paramount importance that water systems (particularly medium, small, and economically distressed systems) focus their limited resources on actions that ensure compliance with existing NPDWRs and maintain their technical, managerial, and financial capacity to improve system operations and the quality of water being provided to their customers, rather than spending resources monitoring for contaminants that are unlikely to occur.” While the EPA finds perchlorate dangerous above certain exposure levels however it doesn’t occur often enough to warrant the regulatory program costs.
Key Stakeholder Comments
The AWWA
On 2 July 2007 the AWWA, building on earlier letters from 2 February 2005 and 27 May 2005, recommended the EPA to regulate perchlorate. The AWWA stated that “National compliance costs for a perchlorate MCL ranging from 2 to 24 [ppb] is smaller than estimated compliance costs for other drinking water regulations.”
In the response period to the request for comment on the final action the AWWA submitted a comment supporting no regulation for perchlorate. Absent withdrawal, the AWWA requested that the EPA adjust monitoring requirements due to the significant burden the current requirements would impose on utilities and primacy agencies. The AWWA pointed out that the 2011 consent decree did not require the EPA to regulate perchlorate only to propose a regulation for perchlorate. The AWWA said the “EPA would be acting in an arbitrary and capricious manner if it finalized a perchlorate regulation because the costs of all three of the proposed MCLGs exceed the benefits.” Michigan v. EPA was cited as an example where the Supreme Court overturned a rule where “EPA refused to consider whether the costs of its decision outweighed the benefits.” The AWWA suggested that there were significant technical flaws in the proposed MCLGs and stated that the new pharmacokinetic/pharmacodynamic modeling the EPA used was a flawed method and criticized its transparency as well as a sensitivity analysis’ lack. As an example, the AWWA cited that the epidemiological data used by the EPA was drawn entirely from non-U.S. populations. However, the AWWA charges that the measured variability between individuals and subpopulations is larger than the small perturbations in fT4 and clinical effects considered in the EPA analysis. If the EPA had decided to regulate perchlorate the AWWA requested that the EPA transition utilities to a 9-year monitoring cycle after a year below the MCL.
The NDRC
The NDRC naturally was displeased with the ruling. The NDRC falsely asserts that the EPA was required to regulate perchlorate under the 2016 consent decree.
The American Academy of Pediatrics
The American Academy of Pediatrics (AAP), a non-profit 67,000 member professional organization for primary care pediatricians, pediatric medical subspecialists, and pediatric surgical specialists dedicated to the health, safety, and well-being of infants, children, adolescents, and young adults requested a lower NDWPR than currently exists. The AAP cited that Children born with even mild, subclinical deficiencies in thyroid function may have lower IQs, higher chances of being diagnosed with attention deficit/hyperactivity disorder (ADHD), and visuospatial difficulties. The AAP ended their comment saying:
[we are] particularly concerned that EPA is considering withdrawing its 2011 determination to regulate perchlorate, relinquishing national oversight over a chemical with well-established health risks in drinking water. This would set a precedent inconsistent with EPA’s stated mission to protect public health. AAP urges the EPA to set a stronger MCLG [maximum contaminant level goal] for perchlorate that is based on all available evidence of potential harms to protect public health. A lower MCLG will allow EPA to generate reporting data that more accurately portrays the populations at risk and to better protect vulnerable populations
California, Massachusetts, New York, and New Jersey, states which all set lower state-based limits on perchlorate, were highly critical of the EPA’s methods and also noted that the traditional EPA risk methods would have set an 8 ppb limit.
The Salt River Pima-Maricopa Indian Community from Arizona stated:
Withdrawal of regulation will only encourage the industry to abandon any preventative measures to contain current contamination
The whole debate seems to center on cost-benefit analysis. Something ignored in all the cost-benefit analysis I’ve seen so far is the tendency for compliance costs to come down overtime with monitoring method development, investment, new treatment technologies, and research. It is unlikely however that costs will significantly drop absent that demand driven development. My time at Camp Edwards as a cadet showed me fireworks platforms can create dangerous plumes in small towns from seemingly innocuous widespread traditions. Massachusetts did not attribute the fireworks plume because that would force the county or state to pay the cleanup costs for that plume instead of the Department of Defense. There are probably many smaller water systems without awareness. The 2010 GAO report states that the EPA does not have a perchlorate tracking system and that perchlorate’s nationwide extent is unknown. It seems likely that larger water systems will be less likely to be contaminated and more cheaply treat perchlorate. The overall background perchlorate concentration falling is mainly due to regulation, as the EPA states particularly in California, Massachusetts, and Nevada. The FDA should also be leaned on to develop more robust perchlorate consumption numbers and most likely remove perchlorate from food contact surfaces. Any perchlorate threshold the EPA sets should incorporate total cumulative dose. With all this in mind however, US water systems are already poor and don’t even spend enough to replace or maintain infrastructure. Overall, I like the Californian approach where a relatively strict criteria was set with easy waiver procedures. Since that was not set the health advisory needs to be updated.
Conclusion
Perchlorate can be included on future CCLs; it most likely should be as well. Without the regulatory spotlight perchlorate is unlikely to gather more evidence for or against regulation. To date no new chemical regulations have been passed since the 1996 SDWA amendments (although the EPA proposed PFAS regulation in March 2020). This may be indicative that the regulatory process is not working although it is positive that the EPA does not waste precious resources regulating trivial contaminants (there are 13 SDWA chemicals which have had zero violations – these were mandated by the 1986 SDWA amendments and should probably be de-listed).
Englewood Chicago community gardens photo by Wendell Hutson
It’s not everyday cross-connection control and backflow makes community news. Recently, The Block Club Chicago indirectly wrote an article on cross-connection control and backflow prevention here which can serve to illustrate some interesting points.
The Block Club’s article is on how small community gardens are folding because Chicago recently changed some rules. The rule changes caused an increase in operational and capital expenditure for these gardens.
Since industrialization, communal gardens subdivided into individual plots have been a popular past time that help reconnect urban dwellers with food sources or escape the city for hobby gardening. In Europe these have been around for centuries. These are called “kolonihaver” in Denmark, “Schrebergarten” in Germany, “Volkstuinen” in the Netherlands, and by other names elsewhere. Some of Chicago’s lower income communities use communal gardens for increased food and nutritional security. In Chicago, the communal gardens also help to maintain city owned land that would otherwise be vacant.
Overview:
Chicago recently updated their cross-connection backflow prevention program requirements mandating reduced pressure zone device instead of the previously required atmospheric vacuum breakers. This change had two distinct consequences. The Block Club article focused on one; the dramatic increase in expenses for community gardens potentially causing several to fold. The second point not emphasized in the article was that this change also protects against backpressure instead of just back-siphonage. The existence of the Block Club’s article seems to point to poor understanding on the part of various stakeholders.
Topical Definitions:
A cross-connection is where the potable water system meets contamination which could affect the quality of the water. Various plumbing codes define cross-connections in different ways but they all generally follow the same pattern. The Uniform Plumbing Code of 2006 defines a cross-connection as:
Any physical connection or arrangement between two otherwise separate piping systems, one of which contains potable water and the other either water of unknown or questionable safety or steam, gas or chemical, whereby there exists the possibility for flow from one system to the other, with the direction offlow depending on the pressure differential between the two systems.
The American Water Works Association (AWWA) acknowledges that a cross-connection can occur between the potable water system and an environment as opposed to a piping system.
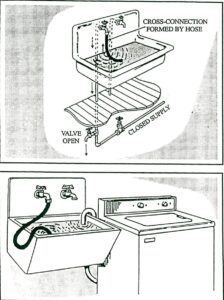
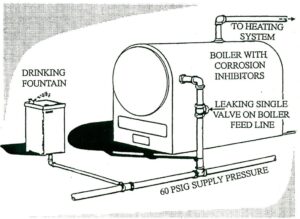
Backflow is essentially the reversal of the hydraulic gradient causing water to flow into the opposite direction. There are two chief kinds of backflow: back siphonage and backpressure. Back siphonage occurs when the potable water system experiences a pressure drop. This causes it to fall below atmospheric pressure and brings water into the system. An example of back siphonage would be a utility/janitor sink that is filled with a non-potable solution and having a main break or similar event compromise system pressure. Back pressure occurs when downstream pressure exceeds supply pressure causing water to reverse flow. Backpressure requires an external force to push back on the water supply as is the case with elevated piping. The American Water Works Association has provided two helpful diagrams to differentiate these two situations:
Back siphonage example from AWWA Manual 14: Backflow Prevention and Cross Connection Control Recommended Practices
Back pressure example from AWWA Manual 14: Backflow Prevention and Cross Connection Control Recommended Practices
Backflow Prevention Devices/Assemblies are specifically manufactured plumbing designed to prohibit backflow. The term ‘device’ is typically used for non-testable backflow prevention fittings while ‘assembly’ normally refers to testable fittings. The American Society of Sanitary Engineering, the American Water Works Association, and the University of Southern California’s Foundation for Cross-Connection Control and Hydraulic Research are the main certifying agencies. It is important to note that devices and assemblies must be installed along a specific orientation; some are only allowed to be installed vertically, others only horizontally, and some in various orientations. Incorrect instillation can preclude the proper function of the assembly. There are six basic types of backflow prevention assemblies: air gaps, barometric loops, vacuum breakers (both atmospheric and pressure), double check valve assemblies, double check with intermediate atmospheric vent assemblies, and reduced pressure principle devices. The type of assembly used is based upon the degree of hazard posed by the type of cross-connection. Atmospheric vacuum breakers for instance are only effective against back siphonage and cannot prevent backflow from backpressure.
Legislative Framework:
The Safe Drinking Water Act allows the federal government to grant primacy to local authorities for the administration and enforcement of federal drinking water rules and regulations. Agencies that have primacy must have cross-connection control rules. State requirements for cross connection control programs are highly inconsistent, and state oversight is also varied. States should have a cross connection control program that includes a process for hazard assessment, the selection of appropriate backflow devices, certification and training of backflow device installers, and certification and training of backflow device inspectors.
Discussion and Conclusions:
Recently, Chicago changed requirements for tapping fire hydrants. Previously, atmospheric vacuum breaker devices were required; now reduced pressure zone devices are.
The Block Club article allows some inferences to be made. For instance, the water used in Chicago’s gardens is unmetered and unpaid for through directly tapping fire hydrants. This water would be considered an “apparent loss” as opposed to a “physical loss” on a water audit. The article further goes onto mention that each growing season costs the garden operators about $400. This represents money which could be used to help maintain Chicago’s decaying water infrastructure. Formerly, there was an environmental department in Chicago that helped to offset these costs for low income communities. This department was cut as part of cost conservation measures. This department did not provide some sort of cost accounting metric for Chicago’s Water Utility Board.
It is surprising that Chicago ever allowed atmospheric vacuum breakers to be used for this purpose as areas which could have pesticides or fertilizers applied to it are high risk. This type of situation is one of the most common causes of backflows in the United States. Transient events such as these are notoriously difficult to determine exact societal burdens for. Acute gastrointestinal issues caused by transient events may or may not be widespread enough to be captured. However, even if acutely deleterious health effects are not apparent introduction of organic matter to chlorinated water causes chronically damaging disinfection byproducts and small amounts of pesticides which over time can lead to a dramatic disease burden. It seems that Chicago did not adequately communicate how the backflow device change serves to protect the health of those served by the water system.
However, typical backflow prevention assemblies normally cost around $300-400 for installation and about $60 for annual testing. The cost in Chicago however is $1,700 for installation and $150 for annual testing.
In addition to benefits in the form of food and nutritional security, communal gardens also represent private citizens taking care of public lands without seeking renumeration from the state for their labor or tools. Free maintenance is a clear benefit for Chicago, although without further detailed cost benefit analysis the cost effectiveness of the strategy cannot be determined. However, the roughly $550 per year ($400 in water costs and $150 for annual testing) seems a reasonable amount for the upgrade and maintenance of communal garden-sized city plots.
Overall, the situation is at best a mixed bag. One of the key issues caused by Chicago’s action is that it removed a key source of food and nutrition from low income communities. An issue unresolved by this change is that Chicago’s water utility was not compensated for the water used. An urgent issue fixed through this change was securing the water quality provided by the utility. While greater stakeholder engagement is unlikely to have resolved these issues it could have helped assuage various stakeholder groups or opened a cost benefit dialogue accounting for the free maintenance the city received for the maintenance of these plots.
The purpose of this article is to
outline America’s Water Infrastructure Act of 2018 (AWIA 2018)
Title II Drinking Water System Improvement Section 2013: Community
Water System Risk and Resilience. The AWIA 2018 addresses the
evaluation and reporting for many facets of infrastructure
encompassing various forms of water and energy as well as providing
funding. The Act was sponsored by Senator Amy Klobuchar (D-MN) and
unanimously passed by the US House of Representatives and US Senate
then signed into law by President Trump on October 23, 2018. The
focus of this article is Section 2013 Community Water System Risk and
Resilience.
Overview
Section 2013 of America’s Water Infrastructure Act of 2018 (AWIA 2018) amended Section 1433 of the Safe Drinking Water Act (SDWA) which added requirements on community water systems that serve 3,300 or more people to complete a risk and resilience assessment then develop an emergency response plan (ERP). Additionally, these must be updated whenever there is a major change in the water system or every five years, whichever is first. The full text of the law may be found here and the Federal Register Notice for New Risk Assessments and Emergency Response Plans for Community Water Systems is available here. Revised Section 1433(a) requires the risk and resiliency assessments, and Revised Section 1433(b) requires the ERPs.
History
In the United States, water system
resilience to natural and manmade incidents and emergency response
preparedness first became a national priority following the terrorist
attacks of September 11th, 2001. Section 401 of the
Public Health Security and Bioterrorism Preparedness and Response Act
of 2002 (Bioterrorism Act of 2002) amended the Safe Drinking Water
Act (SDWA) inserting section 1433-1435. Section 1433 of the SDWA
required all community water systems serving a population greater
than 3,300 to conduct a water system vulnerability assessment. The
assessment was meant to look specifically at terrorism or other
intentional acts intended to substantially disrupt the provision of a
safe and reliable drinking water supply and develop or revise
emergency response plans.
The act specifically required the
following six areas:
A review of pipes and constructed
conveyances
Physical barriers
Water collection, pretreatment,
treatment, storage, and distribution facilities
Electronic, computer, or other
automated systems which are utilized by
the public water system
The use, storage, or handling of
various chemicals
The operations and maintenance of
the system
New Requirements
AWIA has similar requirements for the
risk assessment. The risk assessment shall include an assessment of:
The risk to the system from
malevolent acts and natural hazards
The resilience of the pipes and
constructed conveyances, physical barriers, source water, water
collection and intake, pretreatment, treatment, storage and
distribution facilities, electronic, computer, or other automated
systems (including the security of such systems) which are utilized
by the systems
The monitoring practices of the
system
The financial infrastructure of
the system
The use, storage, or handling of
various chemicals by the system
The operations and maintenance of
the system
And may include an evaluation of
capital and operational needs for risk and resilience management for
the system.
Comparison
The biggest differences between these two laws are the revelation that natural hazards can be as bad as terrorist incidents for an unprepared water systems, an ongoing review/update requirement recognizing the iterative nature of risk, inclusion of the financial infrastructure of the water system, and a copy of the assessment and plan are not required to be forwarded to the United States Environmental Protection Agency (USEPA).
Upcoming Assistance
The law also requires the USEPA to
publish Baseline Information on Malevolent Acts Relevant to
Community Water Systems. This publication will be available by
August 2019 and no water system is able to certify completion of
their risk assessment or ERP until this is published because
utilities are meant to integrate that framework into their risk
assessments. The USEPA administrator is required to consult with
“appropriate departments and agencies of the Federal Government and
with State and local governments” to provide baseline information
on malevolent acts of relevance including any acts which may:
Substantially disrupt the ability
of the water system to provide a safe and reliable supply of
drinking water
Otherwise present significant
public health or economic concerns to the community served by the
system
Certification, Requirements, and Deadlines
The USEPA requires each utility to
submit certification of the risk and resilience assessment and
emergency response plan. Submissions must include: utility name,
date, and a statement that the utility has completed, reviewed, or
revised the assessment. The USEPA has developed an optional
certification template which will be available in August 2019. The
risk assessment and ERP may be self-certified by the utility.
Certifications maybe submitted by regular mail, email, or an online
portal. The online submission portal will provide drinking water
systems with a receipt of submittal. The online portal is the
favored and recommended method. All certification systems will be
available in August 2019. The AWIA 2018 also states that no local,
state, or regional government entities must receive copies of this
certification.
Regardless, water systems serving
greater than 100,000 people must submit the risk assessment by 31
March 2020;
water systems serving between 50,000 and 99,999 by 31 December 2020;
water systems serving between 3,301 and 49,999 by 30 June 2021.
Similarly, the utility must certify to
the USEPA that it has reviewed and, if necessary, revised its ERP.
The ERP is required no later than 6 months after the risk assessment.
This means that a water utility serving greater than 100,000 people
is required to have developed an updated ERP by 30 September 2020, a
system serving between 50,000 and 99,999 is required by 30 June 2021,
and a system serving 3,301 to 49,999 is required by 30 December 2021.
The ERPs are required to include:
Strategies and resources to
improve the resilience of the system, including the physical and
cybersecurity of the system
Plans and procedures that can be
implemented and identification of equipment that can be utilized in
the event of a malevolent or natural hazard that threatens the
ability of the community water system to provide safe drinking water
Actions, procedures, and equipment
which can obviate or significantly lessen the impact of a malevolent
act or natural hazard on the public health and the safety and supply
of drinking water provided to communities and individuals, including
the development of alternative source water options, relocation of
water intakes, and construction of flood protection barriers
Strategies that can be used to aid
in the detection of malevolent acts or natural hazards that threaten
the security or resilience of the system
The AWIA 2018 does not require the use
of any standards, methods, or tools for the risk and resilience
assessment or emergency response plan. AWIA 2018 only requires
utilities to ensure that all criteria in AWIA Section 2013(a) and (b)
are met. The USEPA however, recommends the use of AWWAJ100-10 Risk
and Resilience Management of Water and Wastewater System. The USEPA
also provides some tools to facilitate sound risk and resilience
assessments and ERPs.
Disposition of Bioterrorism Act Assessments
Title IV of the Bioterrorism Act of
2002 required submittal of a written copy of the risk assessment and
ERP to be forwarded to the USEPA. The USEPA intends to destroy these
records however, under AWIA 2018 section 2013(B)(2) utilities may
request their assessments and plans in lieu of destruction by
emailing WSD-Outreach@epa.gov
on their utility letterhead then in the request include the utility
name, address, point of contact, and public water system
identification before the date by which the water system is required
to certify a risk and resilience assessment to the USEPA under
section 1433(A) of the SDWA as amended by section 2013 of the AWIA
2018.
In April 2019, The USEPA Office of Water published a factsheet about the AWIA EPA-817-F-19-004 to help answer some questions about the AWIA requirements. This is available here.
The USEPA is offering in person training on these topics which you can register for here.
Other information on water system resilience is available here.
Finally, Nushat
Dyson was listed as a point of contact and can be reached at
dyson.nushat@epa.gov or
(202) 564-4674.
The purpose of this website is to take a deeper dive in common environmental engineering issues or news and examine the science or requirements behind them.