The Draft WHO PFOS and PFOA Guidelines for Drinking Water Quality

WHO logo
The World Health Organization is considering comments for the updated Guidelines for Drinking Water Quality.

The World Health Organization (WHO) is considering adding PFOA and PFOS into its Guidelines for Drinking Water Quality and is seeking public comment on their background document for development of WHO Guidelines for Drinking Water Quality.  This document is undergoing rolling revisions and accepting public comment using the form here sent to gdwq@who.int by 11 November 2022.  Guidelines for Drinking Water Quality are essentially the WHO’s version of the US EPA’s Health Advisories however, are 5 orders of magnitude higher with 100 ppt individual guidelines for PFOA and PFOS as well as a 500 ppt total PFAS guideline.  This 5 order of magnitude divergence between health agencies is primarily because the US EPA used epidemiological studies to define the reference dose while the WHO primarily relied on toxicology.  Relying on toxicology, the “WHO considered that the uncertainties in identifying the key endpoint applicable to human health following exposure to PFOS and/or PFOA are too significant to derive a HBGV with confidence” (page 79) while the US EPA did not have that issue.  The intent of this article is to go over what the WHO is, why it publishes drinking water quality guidelines, and the comments I submitted.  Please remember that my views are my own and do not reflect my employer’s position!

How the WHO's Guidelines for Drinking Water Quality are organized.
A summary of how the WHO’s Guidelines for Drinking Water are organized.

What is the WHO?

The WHO serves to coordinate and guide public health policy on a global level.  It started as the Office International d’Hygiène Publique (OIHP) or The International Office of Public Hygiene of President Wilson’s failed experiment, the League of Nations.  After the League of Nations folded on 20 April 1946 many of its functions were eventually rolled into the Untied Nations including the WHO. The WHO has been heavily criticized for decades such as by its former leaders and think tanksCriticism stepped up sharply during the ongoing corona virus pandemic. Despite all this, the WHO remains virtually the only true global consensus-building public health organization.  While its influence has weakened in recent years due to other global public health actors such as the World Bank or the Bill and Melinda Gates Foundation, it still is one of the most broadly recognized and supported organizations dedicated to public health.

Why does the WHO publish drinking water quality guidelines?

The WHO itself has been publishing drinking water quality guidelines since 1958 and in fact the WHO’s grandparents were the International Sanitary Conferences (ISC) first held on 23 June 1851 which were established as a result of a cholera pandemic.  The OIHP was initially established to carry out some of the ISC’s recommendations.  Cholera is a waterborne disease; a fact made famous by John Snow and the Broad Street Pump.  By removing a pump handle Dr. Snow helped deal a blow to the miasma theory of disease and served as a founding father to epidemiology; a subject I have a case study in.

John Snow is not only a Game of Thrones character
Wrong John Snow

Outside of this historical context, access to safe drinking water was voted a basic human right by the UN; whether or not a good/service can be considered a right is a discussion for a different day.  

What are the WHO Guideline Values?

The WHO currently recommends individual provisional guidance values of 100 ppt for PFOS and PFOA as well as 500 ppt for total PFAS.  These numbers exactly mirror the EU Drinking Water Directive and are substantially higher than the US EPA recommendations which are 0.004 ppt (or 4 parts per quadrillion) and 0.02 ppt (or 20 parts per quadrillion) for PFOA and PFOS respectively.  A key reason why these values are so dramatically different is that the US EPA considered epidemiological studies while the WHO did not.

The Thinker by Auguste Rodin
The Thinker by Auguste Rodin outside the Musée Rodin in Paris, thanks Wikipedia images.

Throughout the document the WHO uses older thoughts on PFAS and consistently cites the 2016 health advisories.  The US EPA has the most current human health toxicity assessments for PFAS however, the WHO consistently lists them last. 

On page 63 the WHO states (the numbers in the quote are line numbers for that page) “PFOA exposure is associated with clear 23 evidence of carcinogenic activity in male rats based on the increased incidence of liver 24 adenomas and pancreatic acinar cell tumours.” It is therefore not possible using current evidence 25 to exclude PFOA as a human carcinogen”.  This wording reflects the US EPA’s 2016 position; more recent human and animal studies lead the US EPA to conclude that PFOA is a more potent carcinogen than previously thought.

I am not enough of a health scientist to know or provide a meaningful analysis on the health aspects of the document other than the superficial one I just provided pointing out the WHO is using older science. Normally in the debate between epidemiology and toxicology, toxicology points to a more dangerous substance than the epidemiological studies.  Here, due to the preferred analysis by these organizations it appears to be flip flopped.  I would personally prefer to err on the side of caution; especially since drinking water according to the UN is a fundamental human right.

Why I submitted comments to the WHO

Simply put the WHO generally listens if you have a well thought out valid point which conforms to their purpose.  During their last request for comment I (and probably quite a few other people) made quite a few recommendations which were incorporated into this draft document.  For example, I recommended they:

  1. Take into account Xiao’s paper which shows that PFAS can be generated during advanced oxidation processes.  This also changed their practical considerations on monitoring so was quite a substantial change to the document.
  2. Take out the octanol water partitioning coefficient (Kow) from their table of physicochemical properties because PFOA and PFOS are both hydro- and lithophobic so bifurcate into its own layer between octanol and water. Although some people report values, these values are not reflective of the ground truth since the standard test was not designed for that type of material.  They also changed some of the other values such as the boiling point and melting point because the predicted range was larger than the experimental range. 
  3. Specify that anion exchange deals with anionic PFAS since there are cationic and neutral PFAS so there were some changes to those sections as a result.
  4. Drop the “s” from the PFAS acronym for plurals because a substance cannot simultaneously be per- and polyfluorinated so the plural is already implied.
  5. Use the OECD definition of PFAS which they updated.
  6. Use updates I provided on page 71 about characterizing EPA methods 533 and 537.1

One of my comments was almost incorporated word for word on page 74 related to chain length and functional group removal efficacy; a conclusion I partially took from this Sörengård et al. paper.

Previous comments which were not accepted

Not all my previous comments were accepted.  This goes to reflect that two people can look at the same data and draw different conclusions. Especially when the topic is a matter of policy there is often no “correct” answer although there are often clear cut “incorrect” answers. I am going to use this section to highlight some of the comments I made which were rejected, why I made those comments, and potentially the reason why the comment was rejected.  

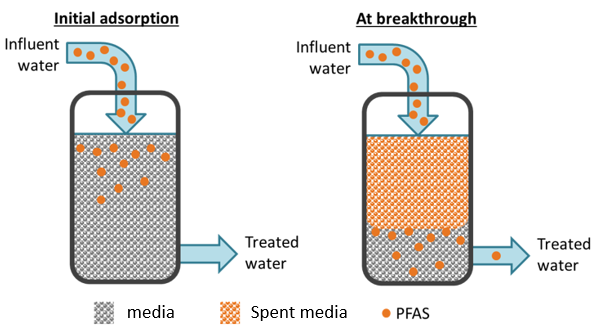
  • I recommended against using percent removal as a characterization of process efficiency. You can think of properly designed granular activated carbon or anion exchange beds as towels wiping up liquid (contaminant).  When the towel is dry and the spill is small it picks up all of it quickly.  A wet towel mopping up a large spill may not clean everything or may not clean it quickly. Try and keep that analogy in mind for a contactor.  The photo below shows one mode for thinking of breakthrough.  Better ways to characterize the efficiency are to use media usage rate or bed life.  I believe that the WHO used percent removal because it makes it easier to compare to membrane filtration although again, I disagree with this characterization.
A schema of how breakthrough occurs in soprtive processes
This diagram shows one way of thinking about breakthrough although it is one of two main conceptual processes currently in the vouge.
  • I provided references which show greater removal percentages for sorption that the WHO quotes. There are many however, the US EPA drinking water treatability database captures many such examples.  The WHO is also much more pessimistic on anion exchange than I believe is warranted based on the data.  There are both full scale, pilot, and bench studies included. I do not really know why the WHO was cautious there compared to their membrane section where results were more often accepted at face value except potentially that was due to the declining efficacy over bed life which again, is why I suggested percent removal is a bad way to measure sorption process efficiency.
  • The WHO focuses on source water monitoring.  In general, this is a good approach however, I do not agree with it for PFAS.  PFAS is not known to and is unlikely to leach or permeate into drinking water supply.   Likewise, PFAS can be generated during treatment when advanced oxidation (and potentially advanced reduction) processes are used.  If resources are constrained it makes more sense to me to monitor the finished water rather than source water if only one is to be monitored especially since source waters are unlikely to change.  The counter argument is that only specific wells could be contaminated, and it would make sense to shut down those wells and not have to treat.  If you only monitor finished water, you will miss that level of detail.  If resources are constrained and you only monitor the influent, you’ll miss that anyway.  To me, this is a good example of two reasonable policy positions based on the same facts with divergent conclusions. 
  • In the previous document, the WHO referenced replacement chemistries; specifically short chained PFAS.  I recommended that esterified replacement chemistries be mentioned as well such as HFPO-DA (also known as GenX chemicals), ADONA, and Nafion byproducts.  Instead, the WHO removed references to replacement chemistries.  This is a good compromise because there are many replacement chemistries available.

My comments on the current draft

On this new draft the comments I have submitted to the WHO using their form emailing to gdwq@who.int (11 November 2022 deadline) are:

  1. The recommendation on page 70 that PFAS monitoring is only required when there is a reasonable source nearby is not protective of public health or in the best interests of society at large.  As this document points out PFAS is capable of long-range transport and deposition.  PFAS has been found in the artic and Antarctic as well as other remote areas.  Additionally, airports; military sites; landfills; wastewater treatment plants; carpet, upholstery, wax, and paper product manufacturers; or spreading biosolids (composting) are all PFAS sources.  Rasstadt, Germany was contaminated with composting from used food containers for example.  I do not believe that you can successfully perform a risk assessment given the diverse set of sources, low toxicity thresholds, and long-range transport capabilities.
  2. Page 72 lines 8-9 state (line numbers in parathesis): “Blending or diluting PFAS contaminated source water with uncontaminated water may be a (9) cost-effective and viable option for some water systems.”  As there is ultra-low toxicity and PFOA as well as PFOS have been identified as likely carcinogens I do not believe that deliberately exposing people to these contaminants through diluting or blending is an appropriate course of action unless there are no other alternatives such as treatment (this would be an economics question) or source substitution.
  3. Page 76 provides information on PFAS removal through sorptive technologies.  I believe, and have provided references above in this article, that significantly lower treatment standards are possible.
  4. On page 16 lines 27-30 it states (line numbers in quotes): “In 2019, the US EPA conducted a broad literature search to evaluate (28) evidence for pathways of human exposure to PFOA and PFOS, and in 2021 released a draft (29) analysis that supports application of a 20 percent relative source contribution for PFOA and (30) PFOS in drinking water (US EPA, 2021b,c).” This seems to overstate the strength of the conclusion the EPA made in those health advisories.  As I mention in this article, the EPA’s position was that there was insufficient evidence to deviate from a 20% default value; not that evidence supported a particular value.
  5. On page 4 line 37-39 it states (line number in parentheses): “PFOA remains possible, even where it is no longer (38) manufactured or used due to its legacy uses, degradation of precursors, and extremely high (39) persistence in the environment and the human body.”  I believe this is also true for PFOS and that disclaimer should be added to that section as well.
  6. Page 74 lines 45-46 deal with anion exchange resin regeneration.  Greater than 95% resin regeneration has been demonstrated in literature here, here, and here although it may not be practical for utilities from a safety and/or cost prospective.
  7. On page 9, the WHO references this Boone et al study; when the study was published the conclusion that only one monitored drinking water plan exceeded the EPA’s HAs was valid however, the HAs were updated.  That changes the study conclusion from one drinking water plan exceeding the EPA’s HAs to all quantitatively monitored plants exceeding the HAs, a significantly different conclusion.

Conclusion and Key Take Aways

Over time, scientific consensus points to greater and greater awareness of the dangers PFAS pose.  Generally, we thought these chemicals were safer in the past than most scientists do today.  The WHO, in its role as a policy leader, has developed a significantly less stringent health recommendation than even the old 2016 US EPA HAs on the dangers of these chemicals by not weighting epidemiological evidence the same way.  The WHO standard exactly mirrors the EU standard under the drinking water directive.  The WHO is a reasonable organization and solicits public comment and feedback as well as generally listening to it.  I highly recommend you share your opinions with the WHO regardless of whether you agree with me and take an active role in global public health.

Further Reading

This is one of several articles on PFAS I have written.  You can read about PFAS discovery, structure, or all my articles on PFAS.

Covid-19 Wastewater Update

Wastewater and public health potentials
Photo from Farkas, K., Hillary, L. S., Malham, S. K., McDonald, J. E., & Jones, D. L. (2020). Wastewater and public health: the potential of wastewater surveillance for monitoring COVID-19. Current Opinion in Environmental Science & Health.

Since my previous article on wastewater based epidemiology (WBE) for SARS-Cov-2 monitoring, there have been rapid developments. According to the World Health Organization’s 12 September 2020 update there have been over 28 million confirmed cases and 900,000 deaths worldwide making it a serious global pandemic. For comparison, last year about 1.7 million people acquired AIDS and 700,000 died. There is growing evidence that built environmental systems, particularly ventilation systems and residential plumbing systems, contribute to SARS-Cov-2 spread.

SARS-Cov-2 in the Gastrointestinal Track

The pooled SARS-Cov-2 viral RNA prevalence in stool samples from clinically confirmed cases is only estimated to be around 50% although estimates range from 15% to 84% in this meta-study and review. These studies unfortunately generally did not have many participants; between 9 and 4,243, with most studies having under 60 participants. Likewise, SARS-Cov-2 loads and viral RNA in fecal samples reported between 1,000 and 10,000,000 SARS-Cov-2 copies per fecal milliliter; one study had 153 participants, where only 44 participants (29%) had viral RNA present, while the other studies all had under 50 total participants.  That study indicated that there was, broadly speaking, a traceable general shedding pattern. During the initial SARS-Cov outbreak in 2002-2003 and MERS-Cov outbreak in 2012, viral RNA was still present in stool samples over 30 days after the illness. Similarly, patients with SARS-Cov-2 in their stool continued to shed RNA viral positive fecal samples after showing negative respiratory/nasopharyngeal samples. The estimated continued positive shedding duration and percentage still shedding varied greatly but reported means vary between 11 days and 5 weeks in 20% to greater than 70% of patients that had positive stool samples. There is limited evidence to suggest that viral RNA in stool comes from live infectious viruses instead of deactivated or destroyed viruses however, testing for the live virus is difficult to do and few people try. Most studies suggest that SARS-Cov-2 in urine is rare however, some studies report its presence past negative throat swabs.

Funny image
This guy has about a 50% chance of containing SARS-Cov-2 when excreted from an infected individual

SARS-Cov-2 in potable water distribution

It is extremely unlikely that SARS-Cov-2 can remain viable in potable water systems, especially in the US where 0.2 mg/L chlorine residual minimum must be at temporally farthest tap. While I could not find information on SARS-Cov-2’s survival in chlorinated water, other human coronaviruses are highly susceptible to chlorination. Likewise, I could not find information on SARS-Cov-2’s survival in non-chlorinated tap water which dominates Europe however, other human coronaviruses showed a three log removal (99.9% removal) at 23°C (73.4°F) in 10 days; at 4°C (39.2°F) human coronaviruses do not show a three log removal after greater 100 days. These results are not particularly helpful.  Cold inlet tap water’s temperature is normally 10-15.5°C (50-60°F) but can vary from 3.6-“jacuzzi temperature” 39°C (38.6- ≈100°F) in the United States (low value is Anchorage, Alaska and the high value is Death Valley, California). The temperature depends on several factors: water age, water source (surface or ground), season, processed water storage, pipe depth, and ambient air temperature. In aggregate however, I cannot derive a scenario where SARS-Cov-2 would proliferate enough in potable water systems to make someone sick through showering for instance.

SARS-Cov-2 in sewers

Similar to potable water, I was unable to find information specific to SARS-Cov-2 however, information on other human coronaviruses is available. Other human coronaviruses die rapidly in wastewater with three log removal (99.9%) occurring between 2 and 4 days for all temperatures. I do not believe there is a general standard time for sewage to reach treatment plants however, most sewers are designed with a self-cleaning velocity that should be reached daily (between 0.6 m/s and 1 m/s mainly dependent on specific gravity and pipe diameter) and are generally capped at 3 m/s during max flow to prevent erosion. Rochester, NY takes about 24 hours for sewage to reach its treatment facilities which is normal and a decent average proxy. All reputable sources agree that standard wastewater treatment processes, which are designed for virus and bacteria inactivation among other things, inactivate SARS-Cov-2. Likewise, dilution occurs in sewers which should increase the minimum infective dose by lowering the virus’ concentration.

SARS-Cov-2 in residential plumbing

Sewers, unlike potable water, are not generally pressurized and are ventilated to eliminate smells. This little distinction is critical.  Circumstantial evidence reported in the Annals of Internal Medicine indicated that 9 people became sick with SARS-Cov-2 from fecal aerosols. This is not the first time that a respiratory disease has been tied to sewage waste vents. The 2003 SARS outbreak at Amoy Gardens in Hong Kong was implicated in 321 cases and 43 deaths. During China’s ultra-strict lockdown, Kang complied camera footage indicating no contact between the sick apartment members and the newly infected group who lived on different floors. Among more than 200 air and surface samples collected, the only ones testing positive for SARS-CoV-2 came from the 15th floor family’s apartment and a vacant apartment’s bathroom on the 16th floor directly above. Tracer gas piped into the 15th floor apartment’s drainpipe exited in the 25th and 27th floor apartment bathrooms. Generally, there is a plumbing “trap” (shaped like a U or P) that has water in it to block smells from rising. These however, can dry out leaving a transmission route for disease. Drying out can occur from non-use or air pressure surges. The ethane tracer gas presence indicates that these traps dried out. Contact tracing and other standard causal patterns did not reveal leads. One team member on Kang’s study indicated that there could also be three other outbreak incidents related to waste vent gases. However, while compelling, there is no iron clad evidence and it is possible the disease was contracted elsewhere. Mechanical bathroom exhaust fans and outdoor air conditions can lead to a favorable environment for SARS-Cov-2 to spread through bathroom exhaust. There should be appropriate caution reading these findings. Many factors must fall into place for this kind of residential transmission. For instance, the proposed transmission route relies on viral infectivity in fecal droplets and aerosols. However, building wastewater systems are a potential reservoir for many other viruses and bacteria, even in the absence of SARS-CoV-2.

SARS-Cov-2 in toilets

Virus-containing fecal aerosols can be produced during toilet flushing after index patient use. These bioaerosols can settle onto surfaces and remain infective. There was a case where a South Korean woman most likely contracted Covid-19 from an airplane toilet. She self-quarantined in complete isolation for three weeks before the flight, did not use public transport to get to the airport, wore an N-95 mask for the entire flight except a visit to the bathroom, all passengers sat two meters (six feet) from each other during boarding, and quarantined for two weeks by South Korean officials on landing. The one asymptomatic sick passenger on the plane used the toilet before her. The most likely transmission route was encountering contaminate surfaces because the airplane used high-efficiency particulate arresting systems. According to Dr. Joseph Allen from Harvard’s T.H. Chan School of Public Health, about 1,000,000 additional particles per air cubic meter are generated when a toilet is flushed with the lid up. These particles can settle on surfaces or linger in the air until someone breaths them in.

Protecting yourself

There are some easy common-sense protective measures you can take to protect yourself. Ensure bathrooms you use are well ventilated, turn on an exhaust fan when entering a bathroom and leave it on when you leave. Make sure the P or U trap isn’t dried out; a bad smell indicates a dry trap. Close the lid when flushing the toilet to help prevent bioaerosols from spreading. Clean and disinfect bathroom surfaces. Most importantly, wash your hands when leaving the bathroom, then try and use a paper towel to touch surfaces including the door handle on your way out.

Potential WBE Advances

To date SARS-Cov-2 Wastewater Based Epidemiology (WBE) relies on the same analytical platforms used in clinical diagnostic testing (eg PCR or antigen testing). WBE does not need to be limited to the monitoring the infectious agent’s nucleic acid or antigens. WBE could target endogenous biomarkers that are significantly elevated in diseased states. This could reduce analytical costs and broaden availability (through immunoassays) or better serving as leading infection indicators (earlier alerts). Urine (as opposed to fecal) biomarkers would also simplify sampling and sample preparation. Since Covid-19 can cause extensive inflammatory damage, biomarker for systemic oxidative stress such as the prostaglandin-like class of substances called isoprostanes are currently being proposed. These biomarkers may be more universally excreted among infected individuals, better track the infection severity, have tighter per-capita excretion ranges (allowing for better case count calibration and estimation), and avoiding a potential under-appreciated problem with using PCR, where RNA fragments may not be originating from viable virus, but rather from virus remnants (litter) from cleared infections. That last issue could overestimate infection incidence or intensity. It is also speculated that patient repeat infection reports are caused by this.

WBE could also be used to test hypotheses involving correlating various community-wide population demographics with the magnitude and duration of SARS-CoV-2 measurements to probe inter-community disparities such as race, culture, income, healthcare availability, and occupation. WBE data could also be examined for correlations with drug manufacturer geographic prescribing data — notably for drugs suspected to improve or exacerbate Covid-19 therapeutic outcomes. WBE could also determine which SARS-CoV-2 subtypes dominate in given populations.

WBE Other Shortcomings

In addition to the difficulties I outlined in my first article on WBE, I have learned about some additional difficulties. Population size estimations are difficult because populations fluctuate due to travel and commuters. The standard approach to this is to measure certain endogenous biomarkers such as cortisol or cotinine then calculate those as daily loads normalized to population sizes. However, some unique population fluctuations have negligible catchment impacts leading to higher uncertainties in smaller populations. Other standard population estimating wastewater parameters used such as Chemical Oxygen Demand, Biochemical Oxygen Demand, or ammonia can reduce uncertainties but can be strongly influenced by the wastewater’s composition. Another is that biomarkers must be relatively stable not only in the sewer system but also through the sampling and storage processes.

Another shortcoming is wastewater itself makes it extremely difficult to extract and quantify biomarkers and chemicals. PCR inhibitors include fats and proteins, as well as humic and fulvic acids. New digital PCR techniques use Poisson distributions, via partitioning samples into reaction wells to lessen these effects.

Previously Unmentioned Successes

WBE can distinguish differences between prescription and consumption of a pharmaceutical. Investigating parent compounds to metabolites ratios or ratios between compound enantiomers in wastewater can distinguish human excretion from direct pharmaceutical disposal in sewers. This distinction ability is important because prescriptions do not necessarily correlate to use. Delayed prescribing is a strategy where doctors prescriptions available but ask patients to delay using them to see if symptoms improve. These initiative successfully reduced antibiotic use in New Zealand, Norway and England; WBE can distinguish how many antibiotics were actually used as opposed to prescribed.

WBE can minimize the tests required to uncover positive cases. Clinical tests need to continually increase test coverage. The ratio between tests required to uncover a single case and total tests is generally the most direct infection extent indicator. A low ratio (when using random sampling) points to a high incidence of infection and therefore the need for more intensive testing until the ratio significantly increases (where increasing testing amounts are required to confirm additional cases). This indicates increasing success in containment or mitigation measures. However, diagnostic tests are never intended for mass surveillance. The tests are generally time-consuming and costly as well as exposing the test administrator. There are two alternatives: increase conventional testing or minimize the tests required to reveal positive cases. Pooled testing procedures increases testing capacity and throughput, especially for PCRs. Pre-targeting subpopulations can help with minimizing the rests required as well. These methods conserve diagnostic tests. Using WBE then can be akin to using a forward observer to improve artillery’s accuracy. This would greatly reduce the demand for diagnostic testing and reduce supply-chain shortages caused by insufficient manufacturing capacity. The metric of success for WBE when used for targeting the use of clinical diagnostic testing would be lower ratios for “Tests Administered” per “Case Confirmed” (counter intuitively, maximize the positivity test rate).

WBE may also be the only way to infer the uninfected population as well as provide perspective on how well diagnostic testing reflects the total population.

Corrections to Previous Article

In my previous article, I mentioned that WBE started around 2001. In the 1980s, Finland, Israel, and Senegal all successfully analyzed sewage samples to assess circulating polio.

Conclusions

You can probably catch Covid-19 from public toilets and in star-crossed circumstances from your neighbor’s toilet. WBE research is developing but remains much more difficult than analyzing for chemicals such as illegal drugs because there are differences in viral shedding patterns, total shedding, viral attenuation during sewer travel, and determining statistically representative sampling. Even in other applications, matrix separations pose difficulties for WBE.  WBE is still an effective epidemiology tool to rapidly monitor disease spread and trends, especially when paired with other contemporary measures. The preponderance of evidence suggests that CoVs are less stable in the environment than other enteric viruses. Water recycling guidelines may have to be revised in light of emergent diseases and viral shedding into sewer systems. Effective surveillance systems are key for the rapid intervention and infectious disease control. WBE is the most effective and cheap near real-time tool available to communities.

Further Reading

  • IWA’s Information resources on water and COVID-19
  • Chan, K. H., Poon, L. L., Cheng, V. C. C., Guan, Y., Hung, I. F. N., Kong, J., … & Peiris, J. S. M. (2004). Detection of SARS coronavirus in patients with suspected SARS. Emerging infectious diseases10(2), 294.
  • Cha, S., & Smith, J. (2020). Explainer: South Korean findings suggest ‘reinfected’ coronavirus cases are false positives. Reuters.
  • Cheung, K. S., Hung, I. F., Chan, P. P., Lung, K. C., Tso, E., Liu, R., … & Yip, C. C. (2020). Gastrointestinal manifestations of SARS-CoV-2 infection and virus load in fecal samples from the Hong Kong cohort and systematic review and meta-analysis. Gastroenterology. https://doi.org/10.1053/j.gastro.2020.03.065
  • Foladori, P., Cutrupi, F., Segata, N., Manara, S., Pinto, F., Malpei, F., … & La Rosa, G. (2020). SARS-CoV-2 from faeces to wastewater treatment: What do we know? A review. Science of the Total Environment743, 140444. https://doi.org/10.1016/j.scitotenv.2020.140444
  • Gundy, P. M., Gerba, C. P., & Pepper, I. L. (2009). Survival of coronaviruses in water and wastewater. Food and Environmental Virology1(1), 10.
  • Heller, L., Mota, C. R., & Greco, D. B. (2020). COVID-19 faecal-oral transmission: Are we asking the right questions?. Science of The Total Environment, 138919.
  • Hovi, T., Shulman, L. M., Van Der Avoort, H., Deshpande, J., Roivainen, M., & De Gourville, E. M. (2012). Role of environmental poliovirus surveillance in global polio eradication and beyond. Epidemiology & Infection140(1), 1-13.
  • Kaiser, Jocelyn (2020) Can you catch COVID-19 from your neighbor’s toilet? Science Magazine
  • O’Brien, J. W., Choi, P. M., Li, J., Thai, P. K., Jiang, G., Tscharke, B. J., … & Thomas, K. V. (2019). Evaluating the stability of three oxidative stress biomarkers under sewer conditions and potential impact for use in wastewater-based epidemiology. Water research, 166, 115068.
  • Petrie, B., Youdan, J., Barden, R., & Kasprzyk-Hordern, B. (2016). New framework to diagnose the direct disposal of prescribed drugs in wastewater–a case study of the antidepressant fluoxetine. Environmental Science & Technology, 50(7), 3781-3789.
  • Wolfel, R., Corman, V. M., Guggemos, W., Seilmaier, M., Zange, S., Müller, M. A., … & Hoelscher, M. (2020). Virological assessment of hospitalized cases of coronavirus disease 2019. Nature. https://doi. org/10.1038/s41586-020-2196-x.
  • Wu, Y., Guo, C., Tang, L., Hong, Z., Zhou, J., Dong, X., … & Kuang, L. (2020). Prolonged presence of SARS-CoV-2 viral RNA in faecal samples. The lancet Gastroenterology & hepatology5(5), 434-435. https://doi.org/10.1016/S2468-1253(20)30083-2

Wastewater and Covid-19 Surveillance

Screenshot of Biobot report
Report from Biobot on Livingston County, MI on Covid-19 from wastewater

Covid-19 is currently a hot topic, environmental health and engineering is no exception. Wastewater is now in international news because of it! This Reuters article from 19 June 2020 for example shows that researchers found RNA from Covid-19 in Milan and Turin’s wastewater in December 2019 before China reported the first cases on 31 December 2019! The Italian National Institutes of Health examined 40 sewage samples collected in northern Italy between October 2019 and February 2020 and found that samples in Milan and Turin from 18 December 2019 showed SARS-Cov-2. Monitoring sewage for health purposes is known as “wastewater-based epidemiology” (WBE).

Early WBE

Using wastewater to track populations is not a new idea. It was first proposed by Christian Daughton in 2001 to track illicit drug use. You can read his paper here. As a former wastewater teacher of mine, COL Timmes, liked to say: “everyone passes through us.” Generally, he meant that you can’t easily hide from the central sewage system. In more polite terms raw wastewater is a reservoir of excretion products such as: parent compounds, metabolites, and genetic material. The earliest widespread use of WBE (then called “sewage epidemiology”) was in 2005 to monitor for illicit drugs which you can find here. After this early case WBE gained traction. At least Australia, Belgium, Germany, Ireland, Italy, the Netherlands, Norway, Spain, South Korea, the United Kingdom, and the United States use WBE to monitor illicit drug use. After this initial use WBE started to take off in public health circles and WBE started to be used to track broader chemical public health indicators, for instance alcohol consumption in Norway, counterfeit medicine distribution in the Netherlands, and even tobacco use in Italy.

Environmental engineers and public health officials eventually realized that any excreted substance that has known kinetic pathways in wastewater could be used to reverse engineer the initial concentration. All these early methods focused on chemicals and were based around mass spectrometry. WBE was then and is still used to study exposure to chemicals or pollutants such as pesticides, herbicides, and flame retardants. After the sewer’s viability as a surveillance network was established, someone around 2008 realized with some work they could use quantitative polymerase chain reaction methods (qPCR) to amplify, detect, and quantify genetic material.

WBE basics

WBE’s popularity continues to increase because exclusive reliance on testing of individuals is slow, costly, and generally impractical. WBE also often serves as a disease early warning indicator because asymptomatic or prodromal individuals typically don’t get tested and there may be underdiagnosis. In cases like this WBE serves as an unbiased community prevalence estimator. This is especially true with Covid-19 whose asymptomatic period is about a fortnight. Ultimately, WBE allows near real-time cheap monitoring of health indicators such as obesity, diabetes, drug use, microbial antibiotic resistance, and disease outbreak. Its use in disease outbreaks offers particularly rich data on genetic diversity of outbreaks and phylogenic analysis can reveal viral ancestry.

In Australia, the University of Queensland has been linking census data to wastewater samples across the country to see the interrelationship between wastewater chemicals and social and economic measures of a population. Doing that opened the study of socioeconomic influences on chemical consumption. This study showed that caffeine consumption is associated with aspects of financial capability and educational attainment in Australia for instance.

WBE success

WBE is successful in sentinel surveillance providing early outbreak warnings and in determining the efficacy of public health interventions. It is remarkably sensitive at picking up infections and viral load in wastewater. For polio for instance, WBE sensitivity is estimated at about 1 case per 10,000 uninfected people. WBE also allows spatial sensitivity by moving “upstream.” WBE can detect variations in circulating strains through phylogenic analysis allowing for comparisons between region and viral genomic evolution. Another important benefit of WBE is that it enables disease prevalence gauging by circumventing individual stigmatization which can arrive from clinical diagnosis (early AIDS research for instance).

SARS-Cov-2 Simplified WBE Procedure

In general all WBE follows the same process: pretreatment, concentration, recovery, secondary concentration, then detection. Detection normally means either molecular analysis or traditional culturing. In an International Water Association (IWA) webinar on 19 June 2020 Charles Gerba, an environmental microbiologist at the Water, Energy, and Sustainable Technology Center (WEST) in the University of Arizona provided an outline of how they were testing:

  • Gather a 500 mL to 1 L sample of wastewater (grab or composite was not specified)
  • Take a 100-250 mL aliquot to process
  • Spike some samples with 229E to test efficiency
  • Store at -80°C for future analysis
  • Centrifuge to remove solids because some virus are lost to solids – in general about 100 mL would spin down to 1-3 mL
  • RT-qPCR: biomarkers (gene targets) N1, N2, N3, E229. Normally N2 and E229 are used to ensure the signal is specific enough. N1 and N3 are typically dropped

Difficulties in WBE Interpretation

WBE sounds amazing and it truly is. It has already been used successfully to track public health threats from polio to alcohol and all these achievements for a field under 20 years old. Its full potential isn’t even near realized at this point. However, there are several issues in the field. The largest is the lack of standardization and inability to compare results between testing facilities. These two factors are intrinsically linked but one will not necessarily solve the other. Another set of issues revolve around tying total loads to population numbers.

Difficulties with standardization

WBE is still a new field. It has not decided upon standards for many common procedures yet. For instance, some areas preform pre-process techniques to lower the risk of catching Covid-19 from working with SARS-Cov-2. Different pre-processing techniques such as pasteurization or filtration, will produce different signal drops.

Even the sample collection is very different. In wastewater there are typically two kinds of sampling: grab and composite. Grab sampling reflects a discrete point in time and space; composite sampling essentially is several grab samples pooled together at regular time or spatial intervals. Composite sampling is the most common in wastewater because varying flow patterns cause hydraulic surges followed by intermittent periods of low to no flow. However, that does not necessarily make it the best method for WBE.

The solids amount in the wastewater can also reduce efficacy of RT-qPCR methods; what phase to analyze (particulate or liquid) can affect results. Likewise, different inhibitors used for sample shipment may reduce the signal strength. The specific method chosen as a standard unfortunately must consider cost as well as effectiveness and test time. Likewise decontamination procedures between tests must be considered.

Difficulties with linking viral loads to population cases

Sewers undergo infiltration and inflow (i/i). Infiltration is where groundwater enters the sewer system through joints or breaks, inflow is where water is channeled into a sewer from various sources into the sewer such as downspouts. Without getting too deep, there are combined, separate, and merged sewer systems referring to surface runoff or sewage removal. Most large cities have merged systems were sewers were initially built as combined but started providing separate runoff and sewage systems. In short, a remote lab won’t necessarily have the proper infrastructural or weather contextualization to interpret the RNA signal in testing.

Another significant hurdle for disease monitoring is figuring out each disease’s excretion pattern. While it may seem reasonable that a greater number of sick people or sicker people excrete a higher viral load this is not always the case. Extrapolating the viral load to clinical cases becomes complicated. If the disease already has a well known viral shedding pattern and spread pattern with significant effort based, on where in the outbreak a disease is, you can get a correlation however it would be predicated upon many assumptions. For diseases with well defined correlations between degree of illness and viral shedding combined with disease transmission knowledge it is not possible to distinguish between one moderately sick person and two or more asymptomatic people with any degree of precision. With novel diseases only trend analysis is possible. Given the unknowns around viral shedding it becomes difficult to determine how the RNA signal drop corresponds with prevalence drops in the local community. It also becomes difficult to determine how strong the signal change needs to be to differentiate from statistical noise.

Correlating viral loads with clinically identified cases becomes even more challenging because of variable excretion rates during the infection, temporal delays, inconsistent spatial variability due to travel leading to use of multiple wastewater treatment systems, i/i, inactivation during transport, or infrequent, absent or inadequate clinical testing. Genomic instability in wastewater, sampling variability (grab/composite), and viral concentration efficiency differences compound these problems.

Where the sample was taken from, for instance from the sewage network or treatment plant, is also believed to effect viral recovery making comparisons difficult. The type of upstream user, for example domestic or industrial, will make a large difference as well. Areas with more septic systems then become harder to check. Likewise there is a divide between smaller more rural populations and larger cities; cities tend to create more normalization and may not necessarily be compared to their rural counterparts.

Practical difficulties with WBE

The best monitoring schedule at what frequency and spatial resolutions remain open questions which most likely vary across diseases. Likewise, who pays for the monitoring is an important consideration. Currently, WEST’s price list is between $350 and $1,250 per sample depending on how exactly they perform and analyze the sample. The quantification level can be tricky as well since most PCR techniques were developed for the clinical setting instead of an environmental one. There is also a privacy issue with this sort of monitoring.

Conclusions

WBE is an amazing tool for disease monitoring but is better suited to looking at trends because direct comparisons across catchments remains elusive. Since some aspects rely on data individual to specific catchments (recent precipitation, sewer condition, length of sewer and viral decay in sewer transport etc…) direct comparisons between viral loads may never really be achieved.

Further Resources

US EPA on Coronavirus in water and wastewater

Research Centers:

Papers:

  • Kitajima, M., Ahmed, W., Bibby, K., Carducci, A., Gerba, C. P., Hamilton, K. A., … & Rose, J. B. (2020). SARS-CoV-2 in wastewater: State of the knowledge and research needs. Science of The Total Environment, 139076
  • Nemudryi, A., Nemudraia, A., Surya, K., Wiegand, T., Buyukyoruk, M., Wilkinson, R., & Wiedenheft, B. (2020). Temporal detection and phylogenetic assessment of SARS-CoV-2 in municipal wastewater. medRxiv : the preprint server for health sciences, 2020.04.15.20066746
  • Venugopal, Anila, Harsha Ganesan, Suresh Selvapuram Sudalaimuthu Raja, Vivekanandhan Govindasamy, Manimekalan Arunachalam, Arul Narayanasamy, Palanisamy Sivaprakash et al. “Novel Wastewater Surveillance Strategy for Early Detection of COVID–19 Hotspots.” Current Opinion in Environmental Science & Health (2020)
  • Ahmed, W., Angel, N., Edson, J., Bibby, K., Bivins, A., O’Brien, J. W., … & Tscharke, B. (2020). First confirmed detection of SARS-CoV-2 in untreated wastewater in Australia: A proof of concept for the wastewater surveillance of COVID-19 in the community. Science of The Total Environment, 138764
  • Gracia-Lor, E., Castiglioni, S., Bade, R., Been, F., Castrignanò, E., Covaci, A., … & Lai, F. Y. (2017). Measuring biomarkers in wastewater as a new source of epidemiological information: Current state and future perspectives. Environment international, 99, 131-150
  • Xagoraraki, I., & O’Brien, E. (2020). Wastewater-based epidemiology for early detection of viral outbreaks. In Women in Water Quality (pp. 75-97). Springer, Cham