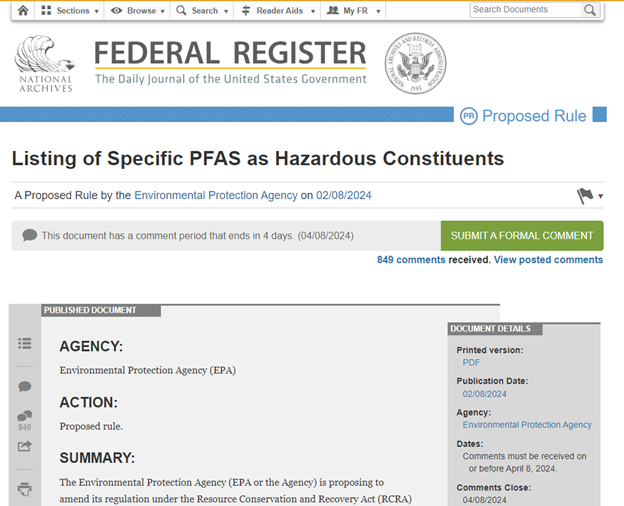
EPA is slightly more than halfway through its public comment period for its PFAS biosolids risk assessment which ends on 17 March 2025. As 18 February 2025 it has exactly 9 comments including one asking for more time; the PFAS drinking water regulation had over 120,000 for comparison. Given the low levels of public engagement, I thought it may be beneficial to explore what biosolids are, how they’re used, what this risk assessment means and why all this matters, then finally my own comment and thoughts. It may help to check out other articles I’ve written on PFAS or wastewater. I am acting in my own capacity; my views are my own and do not represent my employer. Nothing here constitutes legal or professional advice; if you would like professional advice please contact me.
Biosolids Basics
Biosolids are what’s leftover after cleaning your poop. Until treated for safety, biosolids are just sewage sludge. In more technical terms, biosolids are organic leftovers from wastewater treatment that have undergone stabilization to reduce odor and pathogens as well as vector attraction. The term organic leftovers should trigger a thought that biosolids are mostly the result of biological processes which in this case is accurate. That’s because, in the mildly contumelious words of a former teacher of mine, microbes work even cheaper than immigrants. As a former underpaid stranger in a strange land that hits hard.

She’s not quite a mermaid—see?—and she’s not quite human. She sits on land, where she has chosen to stay . . . and she stares eternally out to sea, homesick and forever lonely for what she left behind. She’s everybody who ever made a difficult choice. […] She doesn’t regret her choice, but she must pay for it; every choice must be paid for. The cost to her is not only endless homesickness. She can never be quite human; when she uses her dearly bought feet, every step is on sharp knives
Brief Biosolids Use Cases
The term “biosolids” was first formally recognized in 1991 by the Water Environment Federation, however, have been used for hundreds of years and even have their own popular science promotional book. Biosolids historically have been used as fertilizer (“soil enrichment”) because of their high nitrogen and phosphorous content, for land reclamation either from the ocean or from erosion, and for restoring degraded areas such as mines. A more recent and modern use of biosolids is for biogas production. In 2014, Germany produced 3,050 GWh or enough to power about 305,000 homes (assuming 10,000 kwh per home), a city the size of Mannheim. Biosolids were one of the original pieces of a circular economy, which is a tremendous idea that helps shift waste from a cost center to a revenue driver making compliance a byproduct of maximizing value. I can’t express what a boon that would be for maintaining a clean environment, it’s simply indispensable to a sustainable future.

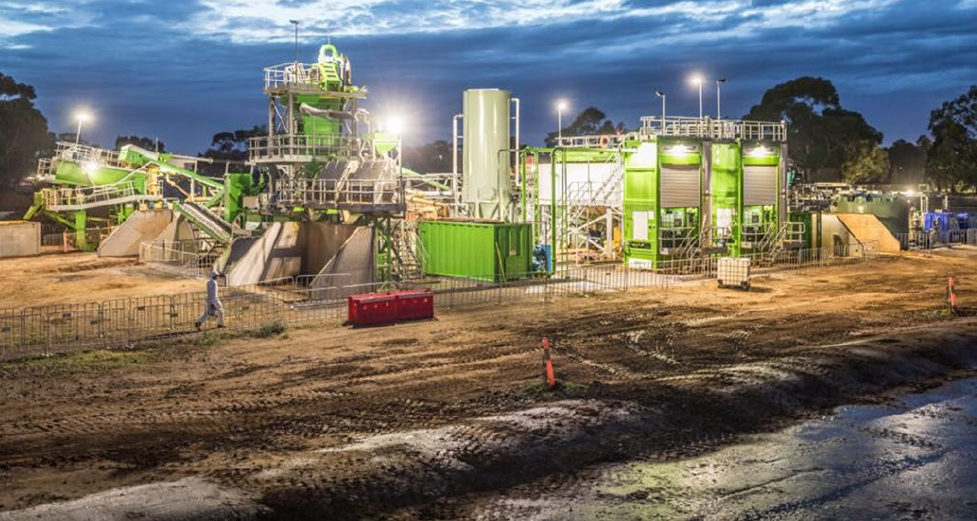
Biosolids Production
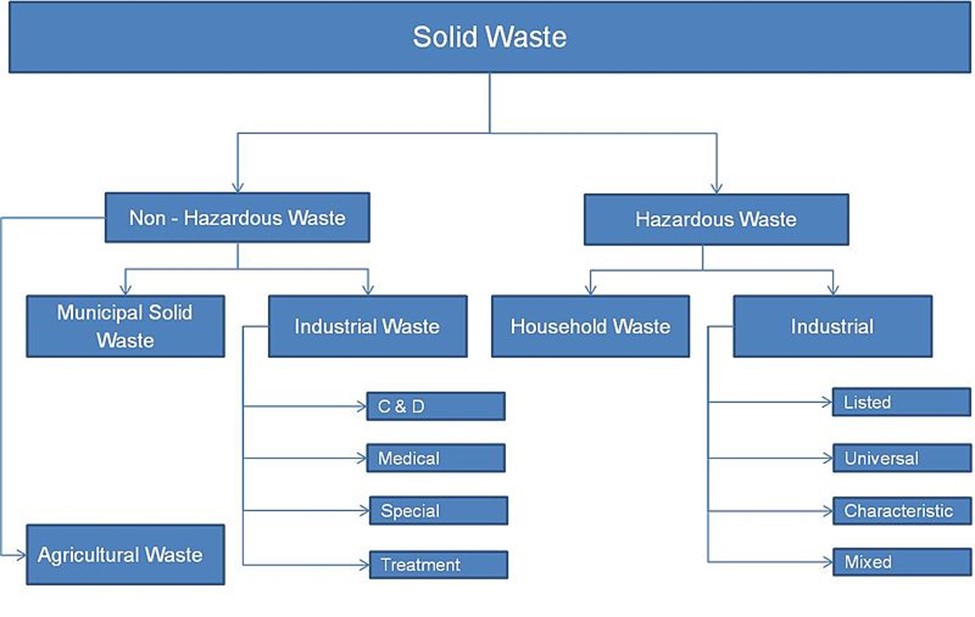
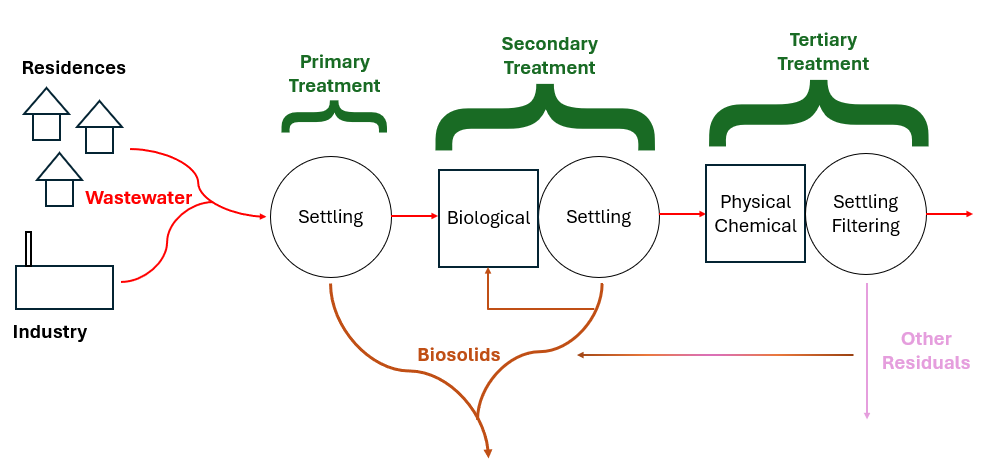
Every water treatment process produces residuals of some kind. Safe and cost-effective residuals management is one of the biggest challenges in every industry and wastewater is no exception. Solids are produced during primary treatment which is generally grit or things caught on a sieve, sometimes known as “screenings.” In secondary treatment, microbes eat the waste, technically called either dissolved or suspended solids depending on the wastes’ physical state; then these microbes and some settleable solids settle out in the primary clarifier. Biomass (microbes) also go to a secondary clarifier and can settle out there in the more quiescent water. Sometimes, tertiary treatment is required to meet environmental guidelines, this often involves chemical or physical treatment which can produce a different type of biosolids. Most biosolids are produced in the clarifiers. The additional biosolids from chemical precipitation are normally contained within either primary or secondary sludge. Tertiary filter backwash contains large volumes of water. Often this residuals stream is recycled through the liquid treatment processes to concentrate the biosolids. Ultimately, a single concentrated biosolids stream consisting of combined sludge is produced. Following wastewater treatment, the solids are then treated to stabilize the readily putrescible materials, reduce volume and destroy pathogens. The final biosolids composition primarily consists of microbial cells and biomass. In particulate form, this biomass contains around 40% carbs, 30% proteins, and 30% lipids. Biosolids can contain organic residues, as well as heavy metals like Ni, Pb, Cr, and Zn, alongside various hazardous pollutants including endocrine disruptors, insecticides, pharmaceuticals, and personal care products. Monitoring is normally required for heavy metals and pathogens but not the other potential hazards.
Biosolids Regulation in the USA

As mentioned, before treatment biosolids are sewage sludge. Treatments which transform sewage sludge into biosolids include anaerobic or aerobic digestion and composting, chemical processes such as lime treatment, and physical processes such as pasteurization, thermal hydrolysis, thermal drying, and air/solar drying. Biosolids are often categorized as “Class A″ or “Class B″ based on the extent of pathogen reduction achieved. The Clean Water Act Section 405(d) requires EPA to create regulations for sewage sludge disposal which are found in 40 CFR Part 503. The Ocean Dumping Ban Act of 1988 did what its name suggests and banned ocean dumping in the United States after 1992 as well as requiring study of the 106-mile Dumpsite, so named because it lies 106 nautical miles southeast of New York Harbor.
Selected Worldwide Biosolids Regulations
In the European Union, the Sewage Sludge Directive (86/278/EEC) encourages sewage sludge use in agriculture whenever harmful effects on soil, vegetation, animals and humans are avoided. In the Netherlands, Switzerland, and South Korea, the biosolids use in agriculture is completely prohibited over concerns stemming from heavy metals, pathogens and organic pollutants. Here sewage sludge is incinerated or used as a component in cement. In Australia, there is no federal sewage sludge recycling and disposal regulation, and guidelines are set out on a state basis. In Brazil, as of 2014 only about 39% of wastewater is actually treated; federal legislation defines the criteria and procedures for biosolids use in agricultural areas through Resolution 375 from August 29th, 2006.

Biosolids Disposal
EPA requires Biosolids Annual Reports from larger wastewater treatment facilities and data can be accessed publicly through ECHO – Enforcement and Compliance History Online, one of EPA’s data warehouses. Biosolids reports come from roughly 2,500 larger facilities in the U.S in the 41 states where the EPA is the permitting authority. Nine states (Arizona, Idaho, Michigan, Ohio, Oklahoma, South Dakota, Texas, Utah, and Wisconsin) are authorized through the National Pollutant Discharge Elimination System (NPDES) Program to be the permitting authority for biosolids. Through phase 2 of the NPDES eRule, these 9 states should start electronically reporting biosolids data by December 2025. For 2022, EPA Managed: ~3.76 million dry metric tons (dmt) of sewage sludge; this compares with total generation of 292.4 million tons of municipal solid waste in 2018 or about 1% of total waste produced was biosolids.

- ~2.12 million dmt was land applied
- ~1.17 million dmt was on agricultural land
- ~39,000 dmt was used for reclamation
- ~906,000 tons had other uses (home garden, landscaping, golf course etc.)
- ~600,000 dmt was incinerated
- ~1 million dmt was landfilled
- ~895,000 dmt was disposed of in a municipal solid waste landfill
- ~111,000 dmt was surface disposed in a monofil
- ~40,000 dmt were managed through other practices including deep well injection and storage
In the European Union About 37% of sewage sludge produced is applied to agricultural land, 12% is used for land reclamation and restoration, and 11% is incinerated. The rest is landfilled (mostly) or used for biogas (rarely).
How does PFAS get into Biosolids?
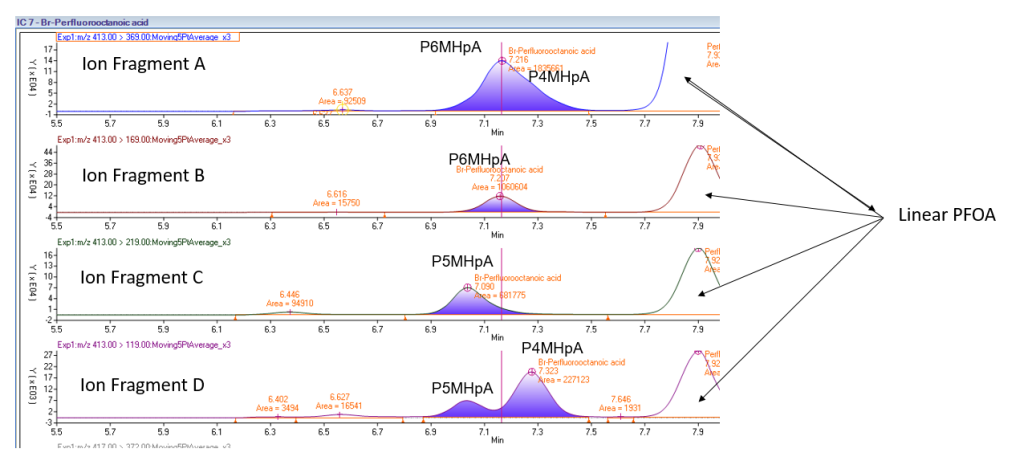
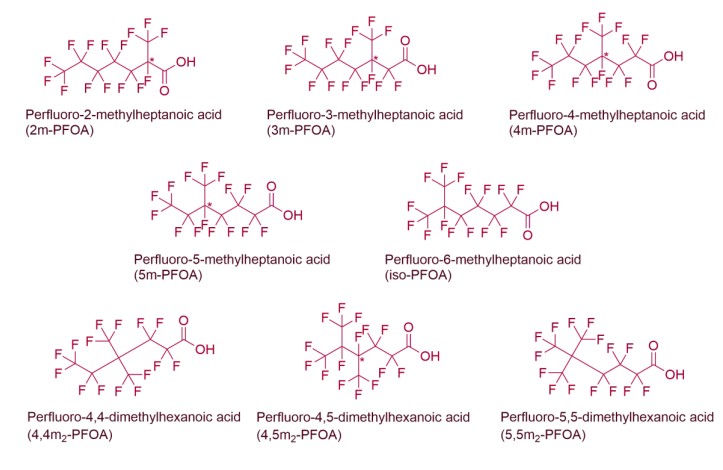
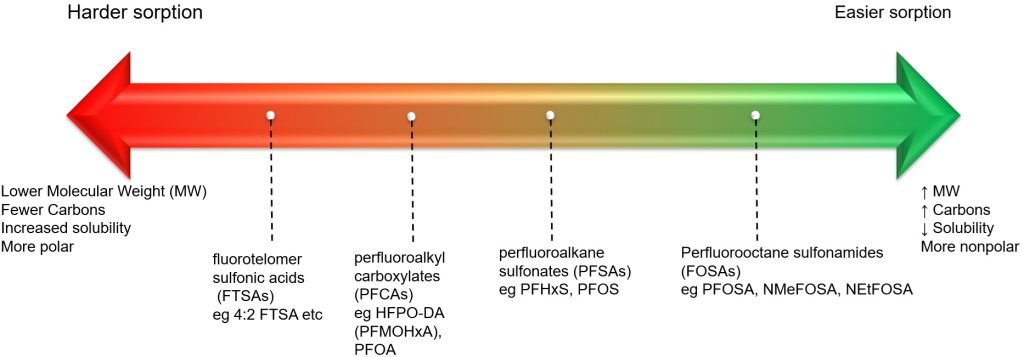
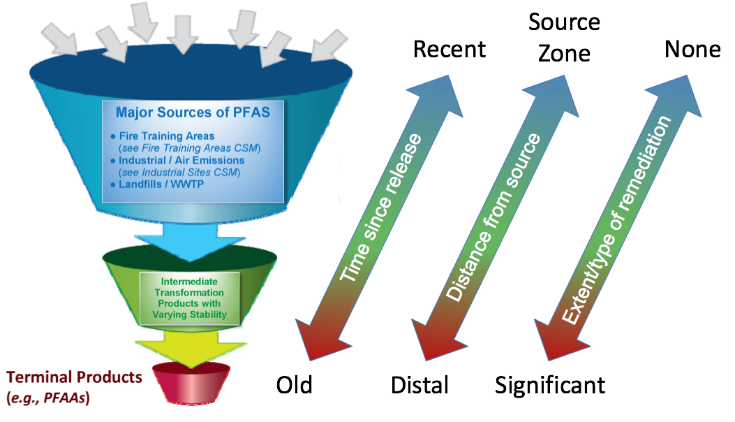
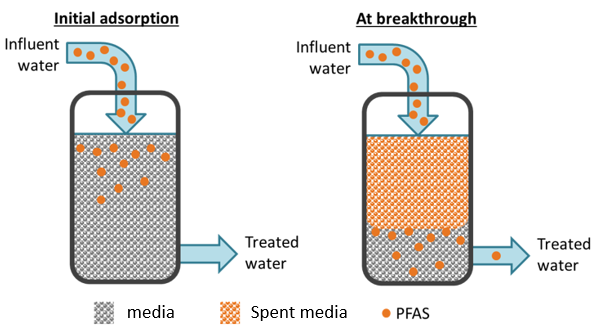
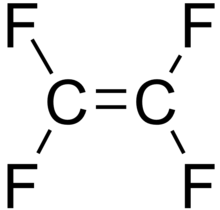
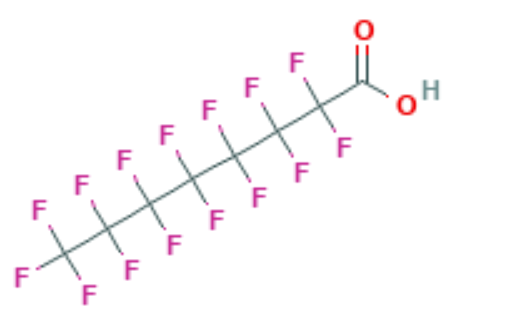
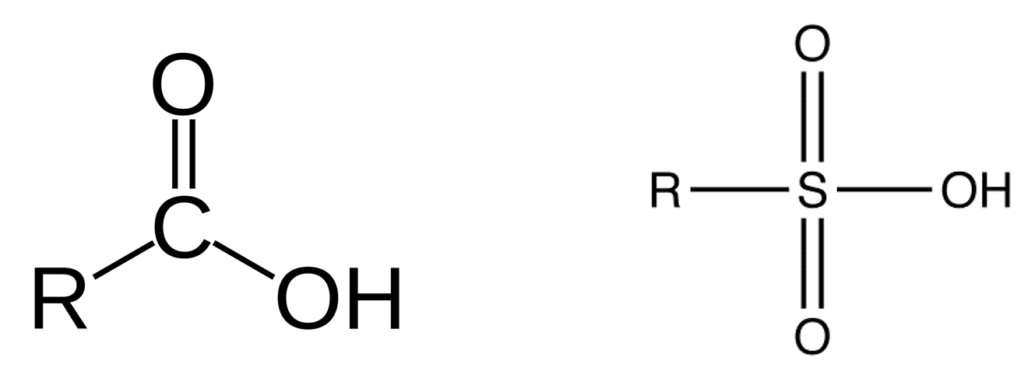
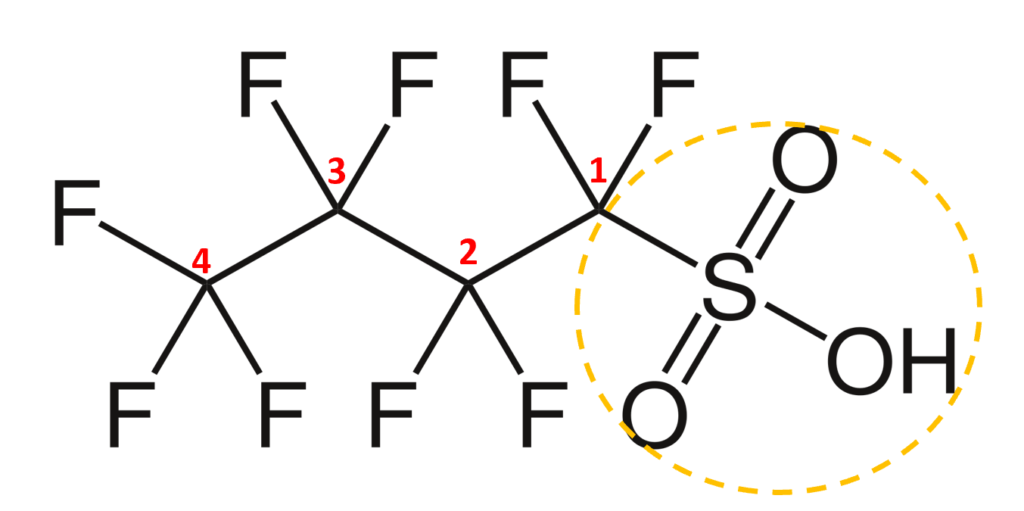
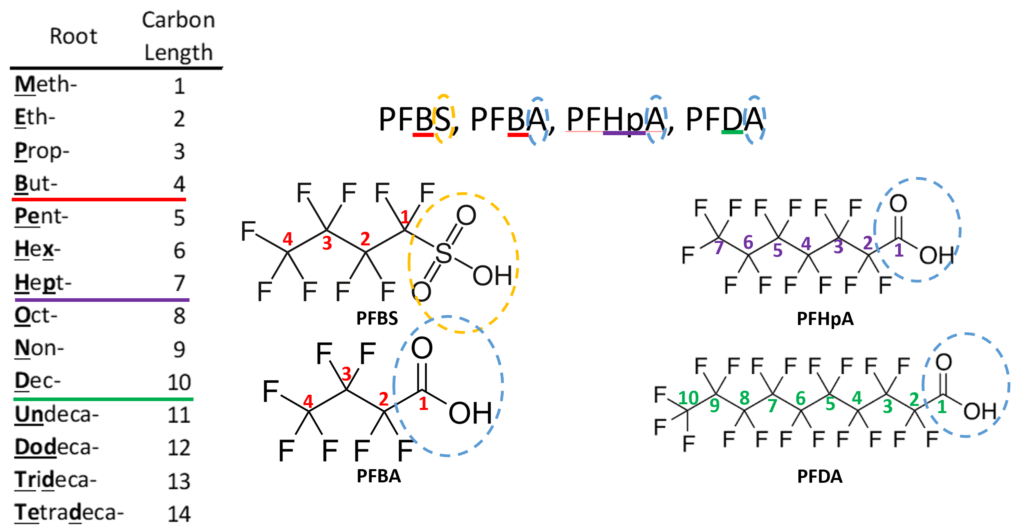
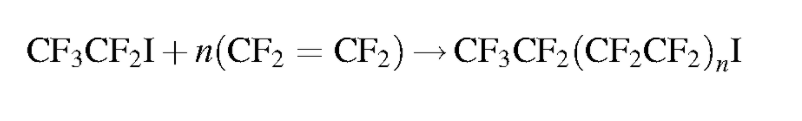
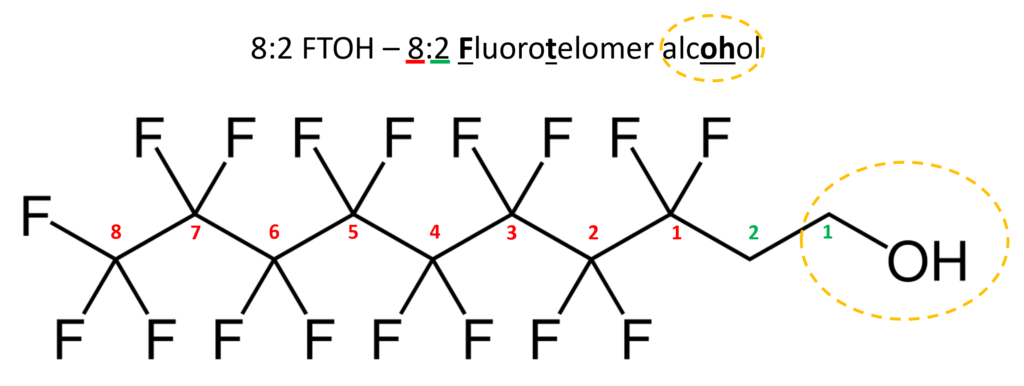
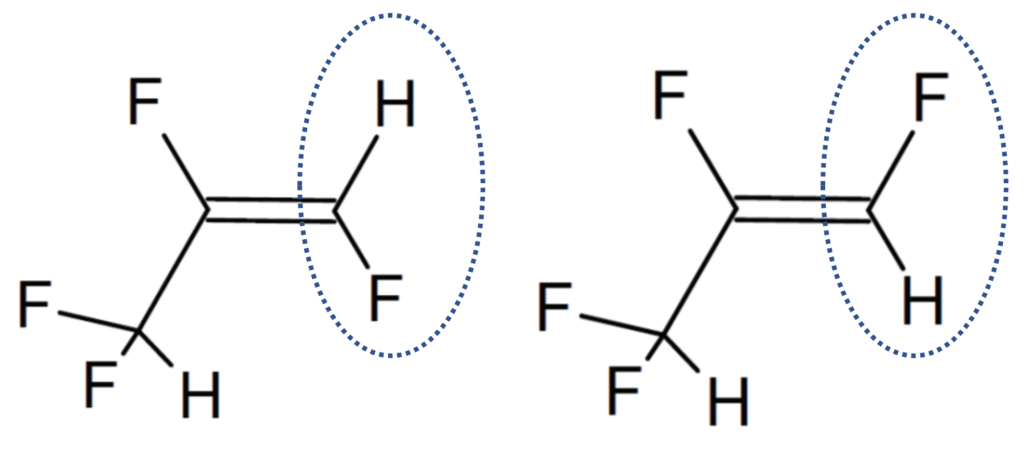
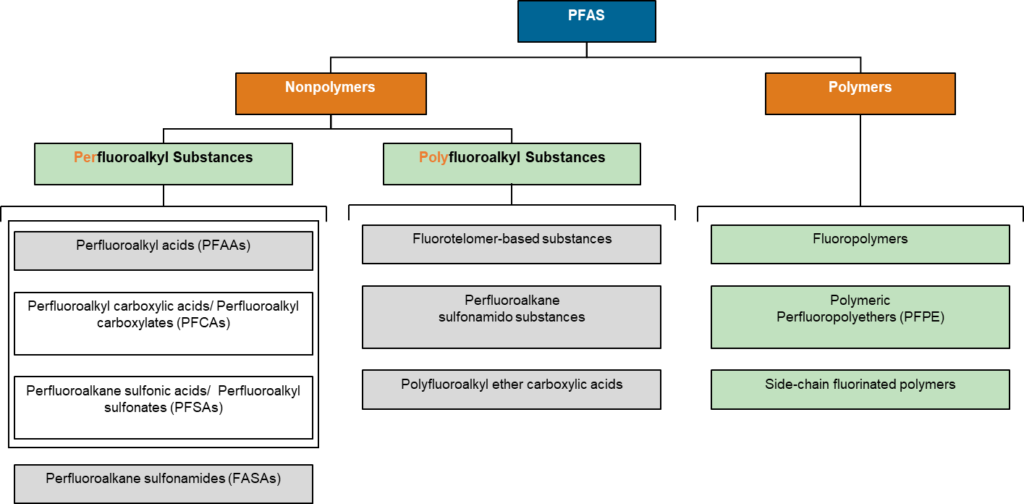
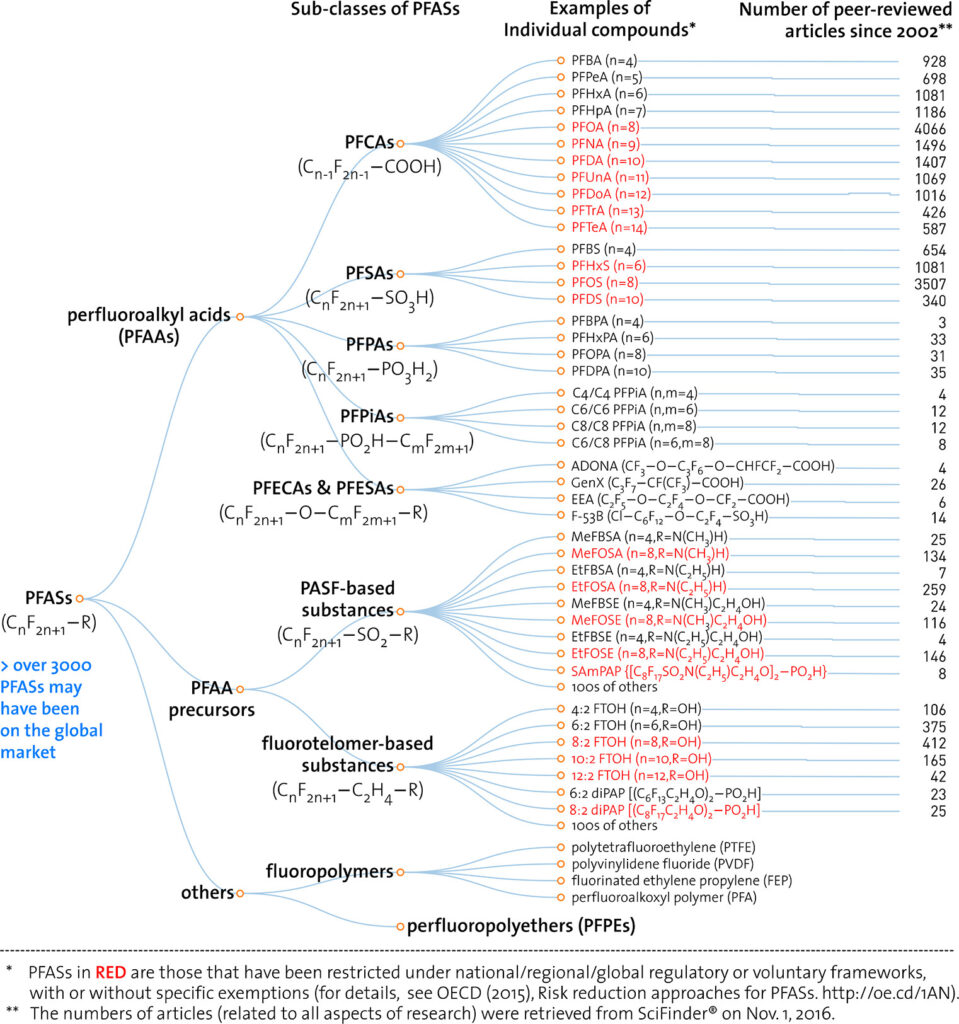
Traditional wastewater treatment does not really remove PFAS however, some PFAS does sorb to sewage sludge and in fact the protein content is currently the best known simple indicator of PFAS sorption for biosolids. Additionally, PFAS is contained in consumer products such as toilet paper, which winds up in biosolids. The dewatering process could also provide two avenues for PFAS to enter biosolids, it could leave behind some PFAS from the dewatering process itself and finally it provides opportunities for fluorinated precursors to biodegrade to PFOA or PFOS, which are terminal degradants. Examples of precursors to PFOS include perfluorooctane sulfonamidoethanol-based phosphate diester (sAmPAPs) containing carbon-chain moieties with at least eight fluorinated carbons, N-ethyl perfluorooctane sulfonamidoethanol (NEtFOSE), N-ethyl perfluorooctane sulfonamidoacetic acid (NEtFOSAA), perfluorooctane sulfonamidoethanol (FOSE), perfluorooctane sulfonamidoacetic acid (FOSAA), N-ethyl perfluorooctane sulfonamide (NEtFOSA), and perfluorooctanesulfonamide (PFOSA). Commonly detected precursors to PFOA include fluorotelomer alcohols (FTOHs), polyfluoroalkyl phosphoric acids (PAPs) and polyfluorinated iodides (PFIs) that contain a fluorinated carbon chain moiety with at least eight carbons in the chain (i.e., 8:2 FTOH). Sidechain fluorotelomer-based polymers (FTPs), especially those used on textiles, could also be significant sources of PFOA to wastewater treatment plants.
How large of a problem are PFAS in Biosolids?
We currently don’t know how big of a problem this is although EPA is trying to find out through its National Sewage Sludge Survey, which was last held in 2006. The National Sewage Sludge Survey is working in collaboration with the publicly owned treatment works (POTW) Influent PFAS Study and will focus on PFAS. The EPA collects biosolids annual reports from roughly 2,500 facilities in the 41 states where the EPA is the permitting authority.
Final thoughts on PFAS in Biosolids
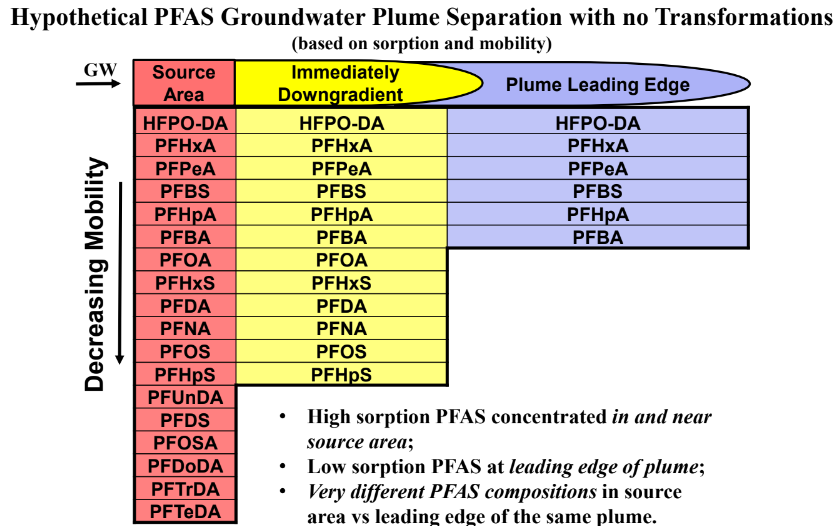
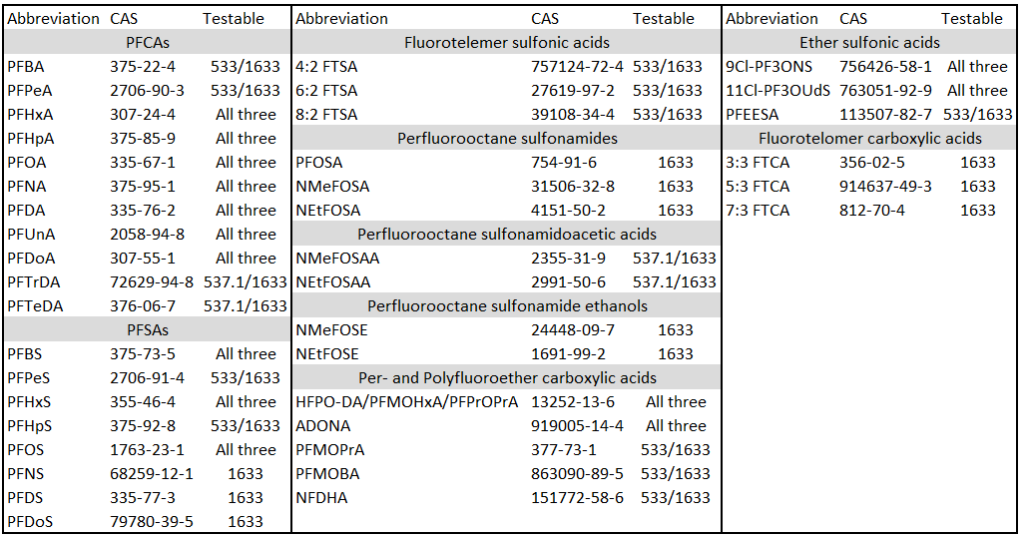
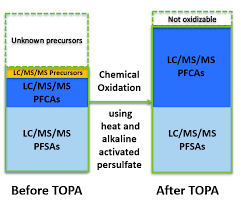
This brings us to the crux of the point; PFAS may be the final nail in the coffin for biosolids. Biosolids have a number of concerns historically related to endocrine disruptors, insecticides, pharmaceuticals, and personal care products but none of these are quite as pernicious as PFAS. None of these as anywhere near as stable as PFAS so applying them to a particular area at a set rate could eventually reach an equilibrium depending on application rate. With PFAS, because they essentially don’t degrade, the only way to reach an equilibrium is to stop the input. Some of the largest contaminated sites in Germany, Rastatt and Arnsberg, come from soil amendments. In Rastatt, over 1,200 hectares were contaminated. In Arnsberg illegal disposal of sewage sludge from paper industry in a biowaste mixture resulted in about 40,000 residents exposed to PFOA at 500-640 ng/L in drinking water which is 125-160x the legal limit in the United States. In general, a centralized source is much much easier to treat and model than diffuse sources such as spreading lots of contaminated soil everywhere. Even worse, PFAS can partition favorably onto and into plants creating a risk for whatever consumes those; even traditional biosolids use despite tight regulation still poses a risk. In this risk assessment, the EPA did not estimate risk associated with occasionally consuming products or drinking water impacted by land application of contaminated sewage sludge nor foods that come from a variety of sources ( e.g., milk from a grocery store that is sourced from many farms and mixed together before being bottled). Additionally, the majority of food produced in the U.S. is not grown on fields where sewage sludge is land applied. However, while true on a national scale, on a local scale this could be problematic, as the risk assessment identifies. Finally, sewage sludge monitoring based on EPA methods (e.g., EPA Method 1633) can be used to test for 40 PFAS but does not include precursors such as sAmPAPs and diPAPs. According to EPA’s risk assessment, several studies using soil columns and non-targeted analysis have found that most of the environmental loading to biosolids will come from these precursor chemicals.

My Comment on the PFAS in Biosolids Risk Assessment
My comment on this risk assessment is that this risk assessment is based on credible well established and supported science and is a good initial step in recognizing the hazards PFAS can pose in biosolids. While diverting all sewage sludge to other means of disposal instead of beneficial reuse represents a large increase in total waste produced and will be more costly, it is easier to contain and treat centralized sources than diffuse sources. As this risk assessment points out, PFAS travel through the environment and have been found in areas with almost no human activity to include the blood of Greenlandic polar bears. This risk assessment fails in only taking PFOA and PFOS into account. While it does mention most of the environmental loading to biosolids comes from precursors, these precursors are not currently tested by EPA methods nor monitored by FDA in the food supply and since an updated National Sewage Sludge Survey isn’t out we don’t know the true extent of the problem posed. Given the difficulties in treating PFAS once in the environment, we need to rethink the biosolids program.

Conclusions
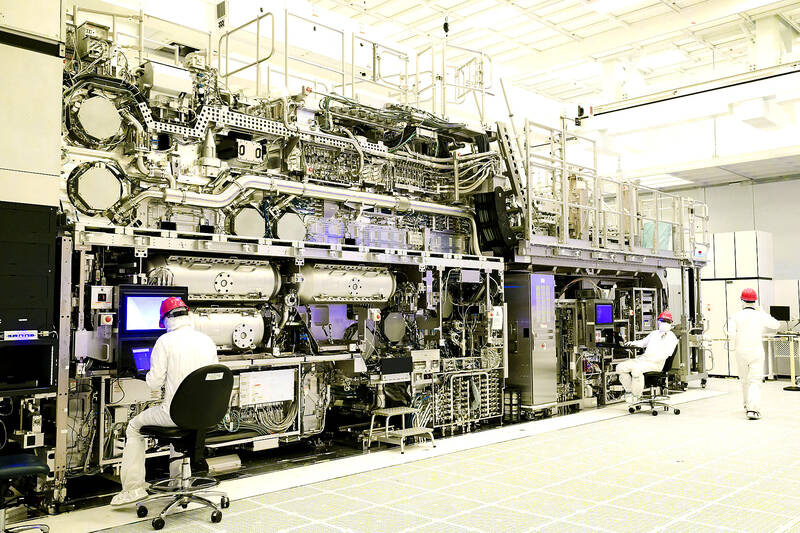
To me it is insane that photolithography can use extreme ultraviolet light to etch 3 and 5 nm process nodes onto silicon wafers but mankind’s first solution to waste would generally be recognizable to our Neanderthal ancestors, dig a hole dump it in shrug and walk away. While today’s landfills are a far cry from ancient midden heaps often with liners, leachate collection, and monitoring in place for gases, leachate, and leaks, the basic concept is the same which underpinned the Culleenamore shell middens. While land application of biosolids is a good example of the circular economy, it needs to be safe and it does not appear to be so. Biosolids disposal poses a significant challenge and PFAS just made it harder.