The EPA recently declined to regulate perchlorate under the Safe Drinking Water Act (SDWA) and promulgated this press release. The Federal Register Final Action Notice is here (RIN:2040-AF28). In general, this decision has been heavily criticized; for instance, a New York Times’ headline read “E.P.A. Won’t Regulate Toxic Compound Linked to Fetal Brain Damage.” The ranking Senate Environment and Public Works Committee member, Senator Tom Carper (D-DE) even said “ [the] EPA has abdicated its responsibility to set federal drinking water standards for a chemical long known to be unsafe, instead leaving it up to states to decide whether or not to protect people from it.” It begs the question why would an agency charged to protect human and environmental health decline to regulate a known hazard? Perhaps more surprisingly, the nation’s water safety and utility advocate, the American Water Works Association (AWWA) agreed with the EPA’s ruling. This article will examine what perchlorate is, what it means to be regulated under the SDWA, perchlorate’s regulatory history, and what the EPA, as well as advocates and critics had to say about the recent ruling. As this is slightly longer than a typical article each section is meant to be relatively self-contained.
What is Perchlorate?
Perchlorates are chemical compounds containing ClO4–. The most common commercial perchlorates are ammonium perchlorate (NH4ClO4), perchloric acid (HClO4), potassium perchlorate (KClO4), sodium perchlorate (NaClO4), and lithium perchlorate (LiClO4). The perchlorate anion may also be bound to other alkali or alkaline earth metals. Perchloric Acid (HClO4) is stronger than sulfuric and nitric acids and is the most common precursor for other perchlorates. Perchlorates can form naturally in the atmosphere leading to trace amounts in precipitation; especially in west Texas, New Mexico, and Northern Chile in the Atacama Desert. Perchlorate is often used as solid-state rocket fuel and is also used in fireworks, flares, gunpowder, and explosives. Surprisingly, given its highly reactive nature, perchlorate can persist in the environment for years. By far the most manufactured perchlorate is ammonium perchlorate for its use in aerospace and defense; it is manufactured more by mass than all other perchlorates combined.
Perchlorate’s uses
The space shuttle’s booster rocket was about 70% ammonium perchlorate and the rest was powdered aluminum or elastomeric binders. Ammonium perchlorate was also responsible for the PEPCON disaster on 4 May 1988 which caused 2 fatalities, 372 injuries, and about $100 million 1988 dollars damage ($218 million in 2020 dollars). The disaster’s damage radius was approximately 10 miles (16 km) and equivalent to about one TNT kiloton or the same yield as a small tactical nuclear weapon. The blast was caught on video by Dennis Todd and has been used in many TV shows. It can be viewed here.
Perchlorates’ use in rocket fuel extends to military applications. Most submarine launched intercontinental ballistic missiles use ammonium perchlorate boosters; because of this many countries, including the US, consider exact perchlorate production, import, and export figures confidential or a state secret. However in 2008, the Department of Defense did publish an estimated use between 6 and 8 million perchlorate pounds annually.
Perchlorate is also used in temporary adhesives, electrolysis baths, batteries, air bag ignitors, matches, desiccants (drying agents), etching agents, electropolishing, ion-exchange chromatography, oxygen candles (used on submarines and in spacecraft), cleaning agents, and oxygen generating systems. Much like the rat poison Warfarin, perchlorates are sometimes used in medical applications. Perchlorate is used to treat overactive thyroids and to counter the drug amiodarone’s side effects. Additionally, perchlorate is used to block radioactive technetium uptake during medical imaging of the brain, blood, and placenta.
Perchlorate in Agriculture
Chilean nitrate fertilizer contained high natural perchlorate levels (0.12-0.26% by weight) and perchlorate is found where this was used; especially on Long Island, New York. Studies have also uncovered perchlorates in synthetic fertilizers in concentrations from 1,800 μg/g to 4,200 μg/g. Likewise, perchlorates have been used in weed killers and leguminous plant growth promoters. Perchlorates have also been used to increase poultry and other farm animal’s weights although there is no evidence perchlorates increase human weight.
Perchlorate, Mars, and Space Travel
Magnesium perchlorate (Mg(ClO4)2) is manufactured in smaller amounts than other perchlorates however, it has been found on Mars in large quantities (>0.6% by weight in soil). Magnesium perchlorate forms the basis for several theories that liquid water can be found on Mars at or below the surface because it has a high solubility (99.3 g/100 mL) and freezing point depression/boiling point elevation falls into colligative properties. A colligative property depends on the quantity of solutes in a solvent rather than the solute’s specific chemical nature. Magnesium perchlorate’s presence on Mars has also led to theories that Mars could be a natural rocket refueling station. Unfortunately, 0.6% by weight in soil is equivalent to 6×10⁶ ppb and would be exceedingly toxic to human settlement.
Where is perchlorate found?
Perchlorates were identified in about 5% of community water systems in the US based on 1997 and 1998 American Water Works Association led studies performed on the EPA’s behalf. A community water system is a water system that serves at least 25 people or 15 service connections; there are about 52,110 community water systems in the United States as of 7 April 2014 according to the CDC. The studies were performed before Standard Method 314.0 was adopted by the EPA and indicated a need for analytical refinements. The Environmental Working Group, a nonprofit environmental activist group that is often labeled as alarmist, suggests that perchlorate was detected in 375 water utilities serving 12.1 million Americans in its Tap Water Database. During EPA mandated tests in 2001 and 2003 under the 1st Unregulated Contaminant Monitoring Rule (UCMR1) perchlorate was found in drinking water systems serving 16.6 million Americans.
Perchlorates were found in at least 60 of the 1,335 sites on the National Priority List (NPL) as of 7 August 2020. There is a good chance the number of NPL sites perchlorate is found at will increase as more sites are evaluated; in 2006 there were only 49 NPL sites with perchlorate remediation out of 1,581 total NPL sites.
As perchlorate is highly soluble, relatively stable, and highly mobile in water and has a low vapor pressure, perchlorates do not volatilize from water or soil to air, leach readily into groundwater, and travel large distances from initial contamination. Perchlorate is only weakly absorbed so its movement through soil is generally un-retarded. These two properties indicate that perchlorate travels rapidly and far in water. For instance, the Olin Flare Facility in Morgan Hill California created a plum which stretched more than 10 miles (16 km). You can read more about the Olin Flare Facility here.
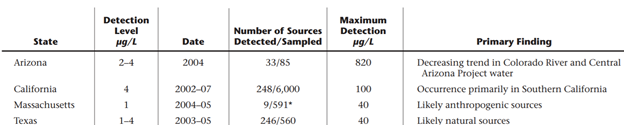
In addition to the UCMR1 studies, Arizona, California, and Texas each completed their own state-based studies summarized in the table below. Texas’ study is particularly interesting because no credible anthropogenic perchlorate source could explain the contamination’s scale or level leading Texas Tech researchers to propose natural contamination.
The AWWA, EPA, and ATSDR (Agency for Toxic Substances and Disease Registry) all agree that perchlorate is not widely dispersed to the environment by rocket combustion. When it is used as a fuel perchlorate is destroyed in the combustion process. Most environmental releases come from anthropogenic releases (manufacturing accidents), fireworks, fertilizer application, and natural formation.
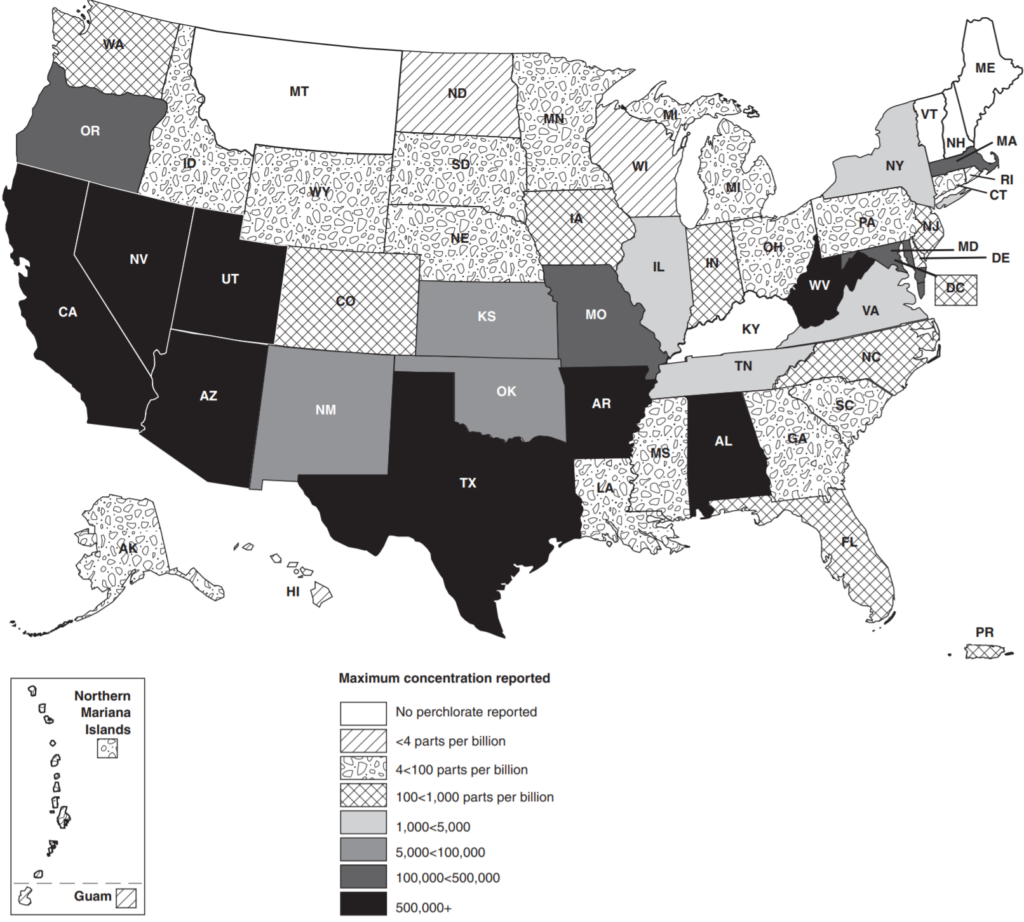
Perchlorate has been detected in most states, the District of Columbia, Puerto Rico, and the Mariana Islands. A contamination map from this 2010 Government Accountability Office (GAO) report is given below.
Surprisingly, potassium perchlorate is also an FDA approved additive in food container rubber gaskets, not to exceed 1% under 21 CFR 177.1210(b)(5). There are perchlorate contamination indications in food. Leafy plants such as tobacco and lettuce and highly vascular plants such as tomatoes have been shown to uptake perchlorate in significant concentrations (upto 164.6 mg/kg dry weight in green flue-cured tobacco). Perchlorates are also found in household bleach that is stored for long times.
Perchlorates health effects
Perchlorates mainly exhibit thyroid toxicity in humans. Perchlorates also partially inhibit thyroidal iodine uptake leading to one medical application for them. Perchlorates are conjectured to lead to hypothyroidism and goiter although this remains unproven. While unproven, perchlorates were used to treat hyperthyroidism for many years leading credence to the suspicion. Side effects from perchlorate treatment included skin rashes, nausea, and vomiting. Some patients developed severe red-blood cell shortages leading to death (fatal aplastic anemia). It is speculated that perchlorate effect depends on gender, exposure length, and dietary iodine consumption.
Perchlorate hurts the thyroid by inhibiting iodine’s transport into thyroid follicle cells by competitive binding to sodium/iodine symporter which catalyzes Na+ and I–‘s transfer. Perchlorate’s inhibition limits iodine levels needed to produce thyroxine (T4) and triiodothyronine (T3). Perchlorate is considered an endocrine disrupting compound because it effects T4 and T3. While perchlorate’s effects are reversible, development problems caused by inadequate circulating hormones are not; leading to conjectured child brain developmental effects and the New York Times’ headline at this article’s start.
Perchlorate was shown to significantly increase systolic blood pressure (the top number in blood pressure readings) which is the maximal arterial pressure when the heart beats. Differences in systolic and diastolic (the bottom number in blood pressure readings or the arterial pressure between beats) are known as pulse pressures. A normal pulse pressure is about 40 mm Hg or less; pulse pressures 60 or greater are considered risk factors for cardiovascular disease, stroke, and heart attacks.
There is some indication that perchlorate may have pulmonary toxicity such as inflammatory infiltrates, alveolar collapse, subpleural thickening, and lymphocyte proliferation.
Perchlorate’s Carcinogenicity
Perchlorates are not considered to be carcinogens by the Department of Health and Human Services or the International Agency for Research on Cancer. It is also conjectured that perchlorate may cause changes in children’s brain development.
The Safe Drinking Water Act (SDWA)
The SDWA, Public Health Services Act Title XIV, is the major federal law protecting drinking water and was first enacted in 1974 with major revisions in 1986 and 1996. The original 1974 act established a system where states, once vetted, are responsible for the SDWA’s implementation and enforcement; this is known as primacy. Primacy may also be granted to Indian Tribes, Territories, and the District of Columbia. In cases where primacy has not been granted to a state, tribe, territory, or district the EPA retains primacy. The EPA has primacy in every Indian tribe except the Navajo Nation, in Wyoming, and the District of Columbia. In every case where primacy was requested it has been granted. To request primacy local regulations at least as stringent as national requirements must be adopted, adequate enforcement procedures must be developed (including monitoring and inspections), and administrative penalty authority must be adopted. Primacy agencies must also conduct water system inventories, maintain records and compliance data, and make reports as EPA may require as well as developing safe water provision emergency plans. Although the SDWA is the major federal law, other laws including the Clean Water Act and various Water Infrastructure Improvement Acts also modify drinking water protection. The SDWA applies to the approximately 152,700 American water systems which supply water to at least 25 people or 15 service connections.
Monitoring Requirements under the SDWA
Primacy agencies may follow the Standardized Monitoring Framework (SMF) or the Alternative Monitoring Guidelines. The SMF was meant to simplify, standardize, and consolidate drinking water monitoring requirements. The SMF was established 30 January 1991 and included 9-year fixed compliance cycles each subset into three periods. The Alternative Monitoring Guidelines allow primacy agencies to grant utilities: monitoring waivers, surrogate sampling and reduced nitrate monitoring.
Under the SMF community water systems serving >10,000 would collect 4 quarterly perchlorate samples during the second compliance period of the fourth compliance cycle (January 1, 2023 through December 31, 2025). Community water systems serving 10,000 or fewer people and non-transient noncommunity water systems would collect 4 quarterly samples during the third compliance period of the fourth compliance cycle (January 1, 2026 through December 31, 2028). The EPA estimated that 60% of surface water systems and 10% of groundwater systems would be ineligible for waivers to reduce monitoring requirements.
SDWA Amendments
The first major SDWA amendments in 1986 were mainly designed to speed the EPA’s contaminant regulation and groundwater protection. The 1986 amendments were extremely ambitious and attempted to make up for lost time since the original act. The 1996 amendments recognized the 1986 amendments were too aspirational and slowed down the required contaminant regulation pace as well as overhauling the entire regulation process. The 1996 amendments gave us the current risk-based regulatory approach used today. Additionally, the 1996 amendments created state-based operator certification programs.
Chemical Regulation under the SDWA
The 1996 SDWA amendments established three requirements for a chemical to be regulated under the Safe Drinking Water Act (SDWA):
- The substance must have an adverse health effect
- It must occur or have a substantial likelihood to occur at adverse public health frequencies and levels
- The EPA’s Administrator must judge regulation to present a meaningful opportunity for health risk reduction
Once the EPA Administrator determines to regulate a contaminant the EPA must propose a rule within 24 months and promulgate a National Primary Drinking Water Regulation (NPDWR) within 18 months after proposal. New regulations generally become effective three years after promulgation and up to two additional years may be provided if capital improvements are needed. Systems serving 3,300 or fewer people may be given an additional 9 years beyond the compliance deadline. The EPA must review and strengthen as appropriate each drinking water regulation every six years. When developing regulations, EPA is required to use the best available, peer reviewed science, supporting studies and data as well as make publicly available a risk assessment document that discusses estimated risks, uncertainties, and studies used in the assessment.
The Unregulated Contaminant Monitoring Rule (UCMR)
The 1996 SDWA amendments also created the Unregulated Contaminant Monitoring Rules. Every 5 years the EPA must publish an unregulated contaminant candidate list (CCL) for chemicals which are known or anticipated to both occur and cause deleterious health effects in public water systems. Additionally, every 5 years the EPA must publish a 30 contaminant or less list that requires a monitoring program by public water systems known as the Unregulated Contaminant Monitoring Rule (UCMR). CCLs and UCMRs are required on a quinquennium basis and are given sequential numbers to refer to the different lists; for example the Third Unregulated Contaminant Monitoring Rule (UCMR3) was published on 2 May 2012 and UCMR4 was published on 20 December 2016. Every 5 years, the EPA is required to make a regulator determination (whether to regulate) for at least 5 of the 30 chemicals under the CCL. Generally, UCMR monitoring is from all public water systems serving more than 10,000 people and 800 representative public water systems serving 10,000 or fewer people. Perchlorate was the first drinking water contaminant that EPA has proposed to regulate in nearly 24 years under the provisions of the Safe Drinking Water Act Amendments of 1996.
Maximum Contaminant Levels (MCL) and a Maximum Contaminant Level Goals (MCLG)
A maximum contaminant level (MCL) is a legally enforceable regulation under the Safe Drinking Water Act. A maximum contaminant level goal (MCLG) is an aspirational non-enforceable public health objective rather than a regulatory standard. For non-carcinogens the MCLG is based on the reference dose. The reference dose essentially is a conservative estimate of the daily allowable contaminant consumption a person can have without an expected adverse health effect during a typical lifetime. As the US adheres to a linear no threshold radiation policy, the MCLG for carcinogens is always zero. MCLs and MCLGs often coincide however, they do not always. Since MCLs are legally enforceable they may not match MCLGs because of difficulties in contaminant measurement, lacking treatment technologies, or treatment cost outweighing public health benefits. MCLs must be set as close as “feasible” using best available technology, treatment techniques, or other means (considering costs) to the MCLG. The EPA may ignore the feasible level if the feasible level could lead to an increase in health risk by increasing other contaminant’s concentration or interfering with treatment processes used to comply with other SDWA requirements. In such cases the overall health risk must be minimized.
For contaminants the EPA wants to regulate but there is no economical or technically viable threshold (MCL), the EPA creates “treatment technique rules” such as the Lead and Copper Rule which are enforceable procedures to minimize risk.
SDWA Cost Benefit Analysis
Criteria three for regulating a contaminant under the SDWA in the 1996 amendments, the EPA Administrator’s judgement to present meaningful health risk reduction, comes with it a required cost-benefit analysis. EPA must publish a “health risk reduction and cost analysis.” For each drinking water standard and each alternative standard being considered, EPA must publish and take comments on quantifiable and nonquantifiable health risk reduction benefits and costs. EPA may promulgate an interim standard without first preparing a health risk reduction and cost analysis or determination whether a regulation’s benefits justify the costs if the Administrator believes that a contaminant presents an urgent public health threat.
If the EPA Administrator determines that the benefits do not justify the costs, the EPA may promulgate a standard that maximizes health risk reduction benefit at a justifiable cost provided by the benefits. The EPA generally has set standards based on technologies affordable for large communities however, P.L. 104-182 requires the EPA to list any technologies or procedures that are affordable for small public water systems serving populations of 10,000 or fewer. If EPA does not identify “compliance” technologies that are affordable for small systems, then the agency must identify small system “variance” technologies or other means that may not achieve the MCL but are protective of public health. The SDWA allows for variances and exceptions based on costs.
Perchlorate Regulation
As of 11 August 2020, drinking water perchlorate is regulated in Arizona, California, Massachusetts, New Jersey, New York, and Texas. In addition, Illinois, Maryland, Nevada, New Mexico, and Wisconsin have advisory levels. The Government Accountability Office states that 10 states have established advisory or health-based perchlorate goals. Perchlorates can be classified as a D001 Resource Conservation and Recovery Act (RCRA) hazardous wastes under 40 CFR 261.23 based on perchlorate’s reactivity characteristic depending on specific circumstances. The EPA has also established a 55 mg/kg residential soil screening level (SSL) and a 720 industrial SSL under Superfund. The Department of Transportation regulates perchlorates under its 49 CFR 172.101 hazardous material table. Various states also list perchlorate as a hazardous substance such as Rhode Island and Pennsylvania.
Perchlorate’s Regulatory history
In 1995, the EPA established a provisional 4 – 18 ppb provisional reference dose range.
In 1997, the EPA first discovered perchlorate contamination in Nevada. At that time, 1,000 pounds (454 kg) per day of perchlorate entered Lake Mead and the Colorado River through contaminated groundwater. Lake Mead provides drinking water to residents of southern Nevada. The contamination originated from the only two perchlorate-manufacturing facilities in the United States at the time.
In August 1997, the Nevada Division of Environmental Protection selected 18 parts per billion (ppb) as the recommended action level for cleanup pending a more current risk assessment. Likewise, California’s Department of Public Health selected 18 ppb action level based on the EPA’s 1995 provisional reference dose range.
In 1998, the EPA published its first draft perchlorate assessment and perchlorate was added to the EPA’s first Contaminant Candidate List (CCL1) indicating that the EPA might be interested in regulating perchlorate. In 1999 perchlorate was included on the EPA’s first Unregulated Contaminant Monitoring Rule (UCMR1). Perchlorate was rolled over into CCL2 in 2005 along with 50 other CCL1 contaminants because the EPA was waiting on monitoring results and health effect studies. Without a regulatory determination perchlorate was rolled into a draft CCL3 in 2008.
In January 2002, the EPA revised its draft assessment with a 1 ppb reference dose (RfD); this assessment was widely criticized although it did cause California to lower its action level to 4 ppb. California selected 4 ppb as that was the 1995 EPA’s lower provisional reference dose range and the lowest level that the era’s analytical methods could detect. After a second peer review which was also not well received by the scientific community, The Department of Defense, The National Aeronautics and Space Administration, The Department of Energy, and the EPA asked the National Academy of Sciences to provide an assessment which it rendered in January 2005 recommending a 0.0007 mg/(kg * day) RfD.
In 2001, perchlorate was detected in Massachusetts’ Military Reservation’s (MMR) groundwater at 600 ppb. The site was investigated from the 1980s when groundwater contamination was first discovered. In 1996 in response to the contamination discovered in Cape Cod’s Aquifer the first of four EPA SDWA administrative orders was issued forcing the Impact Area Ground Water Study Program’s creation. Cape Cod’s aquifer has 6 lenses: Sagamore, Monomoy, Nauset, Chequesset, Pamet, and Pilgram. MMR is situated directly on top of Cape Cod’s aquifer’s most productive part: the Sagamore Lens. About 450 million gallons per day (MGD) flow through Cape Cod’s aquifer with nearly 60% of water flux due to the Sagamore Lens. The Sagamore Lens is the only drinking water source for Cape Cod’s 200,000 year-round and 500,000 seasonal residents. In 1997 the second administrative order was issued; this order mandated that the Army stop all training at MMR. I cannot understate how far reaching this was for the Army. In the “pre-war era” then the Army existed primarily to train. Stopping that main function was akin to ordering Coca-Cola to stop producing soft drinks. That order was the primary driving force behind the Department of Defense’s extensive perchlorate response. The Bourne Water District Officially requested state guidance in March 2002. Massachusetts officially recommended that Bourne should set a 1 ppb limit based on the EPA draft assessment. In 2003, the Massachusetts Department of Environmental Protection established a scientific advisory committee. In February 2004 the committee recommended, and Massachusetts adopted, a 1 ppb advisory level which was below the 4 ppb detection limit available at the time.
In 2003, a federal court in California found that Superfund applied because perchlorate is ignitable and a characteristic hazardous waste. California’s legislature enacted AB 826, the Perchlorate Contamination Prevention Act of 2003, requiring California’s Department of Toxic Substances Control (DTSC) to adopt regulations specifying best management practices for perchlorate and perchlorate-containing substances.
In March 2004, the California EPA Office of Environmental Health Hazard Assessment (OEHHA) set a 6 ppb Public Health Goal (PHG). A PHG is the contaminant level in drinking water that does not pose a significant risk to health. Unlike EPA’s Drinking Water Equivalent Level, OEHHA’s PHG level accounts for exposures to a contaminant from sources besides drinking water. It was not a regulatory requirement. Interestingly, the EPA and the University of California peer reviewed this document even though the EPA had initially suggested a lower reference dose from only water sources.
On 18 February 2005 the EPA set a 0.0007 mg/(kg * day) reference dose (RfD) for perchlorate consistent with the January 2005 National Academy of Sciences report. A (RfD) is a scientific estimate of a daily exposure level that is not expected to cause adverse health effects in humans with a 10 fold conservative uncertainty factor (meaning the level expected to not cause adverse health effects in health humans (No Observed Effect Level – NOEL) is actually 0.007 mg/(kg * day); the 10 fold uncertainty is to cover scientific error such as variability across life-stages, individuals, or genders and protect sensitive sub-groups such as fetuses). EPA’s RfD translated to a 24.5 ppb Drinking Water Equivalent Level (DWEL). In dilute water a part per billion is equivalent to a microgram per liter μg/L. A Drinking Water Equivalent Level, which assumes that all contamination comes from drinking water and is the contaminant concentration an average citizen will have no adverse effect with a margin of safety. Exposures above the DWEL are not necessarily considered unsafe because of the built-in safety margin. EPA’s Superfund cleanup program issued 24.5 ppb cleanup guidance based on the RfD.
In July 2006 Massachusetts became the first state to adopt a regulatory standard when it promulgated a 2 ppb perchlorate state drinking water standard. To arrive at a drinking water standard, the department considered information on the availability and feasibility of testing and treatment technologies, as well as data that demonstrated that perchlorate can enter drinking water as a by-product of hypochlorite (bleach) solutions used as disinfectants. The department chose to set the standard at a level that did not create disincentives for public water systems to disinfect their water supplies. The department determined that a maximum contaminant level of 2 parts per billion would provide the best overall protection of public health, considering the benefits of disinfection, while retaining a margin of safety to account for uncertainties in the available data.
In October 2007, California promulgated a 6 ppb regulatory standard. By law, the California Department of Public Health is required to set a drinking water standard as close to the public health goal as is economically and technologically feasible. California found that large water systems could meet the standard with $18 per customer annual costs while annual costs for smaller systems ranged from $300 to $1,580. The Department of Public Health proposed economic based variances for systems serving less than 10,000 customers if the estimated annual treatment cost per household exceeds 1% of the median household income in the community served.
On 10 October 2008, under President George W. Bush and EPA Administrator Marcus Peacock, the EPA published a preliminary determination not to regulate perchlorate. Administrator Peacock found that there was no meaningful opportunity for health risk reduction.
In January 2009, the EPA issued a 15 μg/L Interim Health Advisory for perchlorate (EPA 822-R-08-25) based on the Office of Water’s analysis to assist state and local officials in addressing contamination while the EPA conducted its perchlorate risk reduction evaluation.
In April 2010 the EPA’s Office of the Inspector General released a report critiquing the risk assessment process and procedures used by the EPA to develop and derive the perchlorate RfD.
On 11 February 2011, under President Barrack Obama and EPA Administrator Lisa Jackson, the EPA reversed this decision and decided to regulate perchlorate however, it provided no specific regulatory proposals. This decision caused me personally much consternation as I was writing my bachelor’s thesis on modeling perchlorate in groundwater using the Complex Variable Boundary Element Method and forced me to re-write several sections just before it was due!
In September 2012 the US Chamber of Commerce submitted a request for correction under the Information Quality Act regarding the regulatory decision. The EPA formed a Scientific Advisory Board that recommended many changes to the data under the decision. The Scientific Advisory Board recommended that the EPA abandon the standard RfD based MCL approach in favor of physiologically based pharmacokinetic/pharmacodynamic modeling based on mode of action. The EPA accepted and followed this advice.
On 18 February 2016, the National Defense Resource Council (NDRC), filed a complaint against the EPA essentially saying the EPA was failing in its mandate because the EPA had not yet proposed a perchlorate limit. The NDRC is a non-profit environmental advocacy group which started as a Scenic Hudson Preservation Conference outgrowth; oddly enough this group was created to block Consolidated Edison plans for a powerplant on Storm King Mountain right by West Point, New York.
On 18 October 2016 the NDRC and EPA reached consent degree in which the EPA did not admit to failing to comply with statutory obligations. The EPA entered the consent decree to prevent judicial interference with the remedial plan that it preferred. The EPA also expressly reserved all discretion under the SDWA and general administrative law principles. Basically, the NDRC simply wanted the EPA to hurry up and propose specific limits. Its important to note that the EPA could NOT have promised the NDRC any specific regulatory changes because that would violate the Administrative Procedures Act (APA). Agencies may agree to consider rule-making changes and to adopt regulations required by law, but they generally will not make substantive commitments concerning the content of regulations that are subject to APA requirements. The consent decree required the EPA to issue national drinking water regulation for perchlorate by 19 December 2019. The EPA asked, and the NDRC agreed, to extend the deadline until 19 June 2020.
On 23 May 2020 EPA Administrator Andrew R. Wheeler signed a proposed rule issued on 26 June 2019 setting a maximum contaminant level (MCL) coincidental with a maximum contaminant level goal (MCLG) of 56 micrograms per liter (μg/L). Alternatives included in the proposal were 18 μg/L or 90 μg/L MCLs coinciding with MCLGs, establishing an MCLG of 18, 56, or 90 with a National Drinking Water Standard, and withdrawing its 2011 decision to regulate perchlorate.
On 18 June 2020, after the public comment period, the EPA issued a press release about the final action declining to regulate perchlorate under the Safe Drinking Water Act. The NDRC was given until 9 July 2020 to challenge the scientific footing the EPA used; which it did. On 21 July 2020, the EPA published this final action. It is likely that the NDRC will sue the EPA to try and force a different outcome.
The EPA’s Stated Opinion
On 18 June 2020, the EPA issued a press release about the final action declining to regulate perchlorate under the Safe Drinking Water Act. On 21 July 2020, the EPA published this final action. EPA Administrator Andrew Wheeler said “State and local water systems are effectively and efficiently managing levels of perchlorate. Our state partners deserve credit for their leadership on protecting public health in their communities, not unnecessary federal intervention.” The EPA cited three main criteria for declining to regulate perchlorate:
- Californian and Massachusetts’ state level regulation of perchlorate (these two states constituted about 60% of what would have been exceedances in the new rule; the exceedances were based on the old UCMR1 monitoring campaign updated with current conditions from Massachusetts and California)
- Current remediation efforts to address perchlorate contamination especially in Nevada contaminating the Colorado River and Lake Meade as well as overall decreasing perchlorate levels
- Improved storage and handling procedures for drinking water disinfectants
Oddly enough, in the actual final regulatory action the third criteria cited was not mentioned. Improved bleach storage and handling only appeared in the press release.
The EPA’s analysis found that nationwide perchlorate regulation costs would significantly outweigh benefits and decided to focus its limited resources on more immediate and significant public health concerns. The EPA also cited historical precedent. By the EPA’s analysis the pesticide Aldrin (a DDT component) would have affected more water systems than perchlorate does, and the EPA declined to regulate Aldrin in 2003. The EPA also estimated that implementing a perchlorate regulation would cost $9.5-18M while the benefits only ranged from $0.3-3.7M. The EPA argued that perchlorate’s infrequent occurrence at concerning levels imposes high monitoring and administrative cost burdens on states and public water systems without rendering net tangible benefits.
The EPA wrote: “It is of paramount importance that water systems (particularly medium, small, and economically distressed systems) focus their limited resources on actions that ensure compliance with existing NPDWRs and maintain their technical, managerial, and financial capacity to improve system operations and the quality of water being provided to their customers, rather than spending resources monitoring for contaminants that are unlikely to occur.” While the EPA finds perchlorate dangerous above certain exposure levels however it doesn’t occur often enough to warrant the regulatory program costs.
Key Stakeholder Comments
The AWWA
On 2 July 2007 the AWWA, building on earlier letters from 2 February 2005 and 27 May 2005, recommended the EPA to regulate perchlorate. The AWWA stated that “National compliance costs for a perchlorate MCL ranging from 2 to 24 [ppb] is smaller than estimated compliance costs for other drinking water regulations.”
In the response period to the request for comment on the final action the AWWA submitted a comment supporting no regulation for perchlorate. Absent withdrawal, the AWWA requested that the EPA adjust monitoring requirements due to the significant burden the current requirements would impose on utilities and primacy agencies. The AWWA pointed out that the 2011 consent decree did not require the EPA to regulate perchlorate only to propose a regulation for perchlorate. The AWWA said the “EPA would be acting in an arbitrary and capricious manner if it finalized a perchlorate regulation because the costs of all three of the proposed MCLGs exceed the benefits.” Michigan v. EPA was cited as an example where the Supreme Court overturned a rule where “EPA refused to consider whether the costs of its decision outweighed the benefits.” The AWWA suggested that there were significant technical flaws in the proposed MCLGs and stated that the new pharmacokinetic/pharmacodynamic modeling the EPA used was a flawed method and criticized its transparency as well as a sensitivity analysis’ lack. As an example, the AWWA cited that the epidemiological data used by the EPA was drawn entirely from non-U.S. populations. However, the AWWA charges that the measured variability between individuals and subpopulations is larger than the small perturbations in fT4 and clinical effects considered in the EPA analysis. If the EPA had decided to regulate perchlorate the AWWA requested that the EPA transition utilities to a 9-year monitoring cycle after a year below the MCL.
The NDRC
The NDRC naturally was displeased with the ruling. The NDRC falsely asserts that the EPA was required to regulate perchlorate under the 2016 consent decree.
The American Academy of Pediatrics
The American Academy of Pediatrics (AAP), a non-profit 67,000 member professional organization for primary care pediatricians, pediatric medical subspecialists, and pediatric surgical specialists dedicated to the health, safety, and well-being of infants, children, adolescents, and young adults requested a lower NDWPR than currently exists. The AAP cited that Children born with even mild, subclinical deficiencies in thyroid function may have lower IQs, higher chances of being diagnosed with attention deficit/hyperactivity disorder (ADHD), and visuospatial difficulties. The AAP ended their comment saying:
[we are] particularly concerned that EPA is considering withdrawing its 2011 determination to regulate perchlorate, relinquishing national oversight over a chemical with well-established health risks in drinking water. This would set a precedent inconsistent with EPA’s stated mission to protect public health. AAP urges the EPA to set a stronger MCLG [maximum contaminant level goal] for perchlorate that is based on all available evidence of potential harms to protect public health. A lower MCLG will allow EPA to generate reporting data that more accurately portrays the populations at risk and to better protect vulnerable populations
American Academy of Pediatrics comment on perchlorate’s final action
Primacy Agencies
California, Massachusetts, New York, and New Jersey, states which all set lower state-based limits on perchlorate, were highly critical of the EPA’s methods and also noted that the traditional EPA risk methods would have set an 8 ppb limit.
The Salt River Pima-Maricopa Indian Community from Arizona stated:
Withdrawal of regulation will only encourage the industry to abandon any preventative measures to contain current contamination
Salt River Pima-Maricopa Indian Community comment on perchlorate’s final action
My Personal Thoughts
The whole debate seems to center on cost-benefit analysis. Something ignored in all the cost-benefit analysis I’ve seen so far is the tendency for compliance costs to come down overtime with monitoring method development, investment, new treatment technologies, and research. It is unlikely however that costs will significantly drop absent that demand driven development. My time at Camp Edwards as a cadet showed me fireworks platforms can create dangerous plumes in small towns from seemingly innocuous widespread traditions. Massachusetts did not attribute the fireworks plume because that would force the county or state to pay the cleanup costs for that plume instead of the Department of Defense. There are probably many smaller water systems without awareness. The 2010 GAO report states that the EPA does not have a perchlorate tracking system and that perchlorate’s nationwide extent is unknown. It seems likely that larger water systems will be less likely to be contaminated and more cheaply treat perchlorate. The overall background perchlorate concentration falling is mainly due to regulation, as the EPA states particularly in California, Massachusetts, and Nevada. The FDA should also be leaned on to develop more robust perchlorate consumption numbers and most likely remove perchlorate from food contact surfaces. Any perchlorate threshold the EPA sets should incorporate total cumulative dose. With all this in mind however, US water systems are already poor and don’t even spend enough to replace or maintain infrastructure. Overall, I like the Californian approach where a relatively strict criteria was set with easy waiver procedures. Since that was not set the health advisory needs to be updated.
Conclusion
Perchlorate can be included on future CCLs; it most likely should be as well. Without the regulatory spotlight perchlorate is unlikely to gather more evidence for or against regulation. To date no new chemical regulations have been passed since the 1996 SDWA amendments (although the EPA proposed PFAS regulation in March 2020). This may be indicative that the regulatory process is not working although it is positive that the EPA does not waste precious resources regulating trivial contaminants (there are 13 SDWA chemicals which have had zero violations – these were mandated by the 1986 SDWA amendments and should probably be de-listed).
References and Further Reading
- The EPA’s perchlorate in drinking water website
- Federal Register publication notice
- National Priorities List
- National Priorities List by State
- RfD Set
- 2016 NRDC and EPA consent decree
- EPA Region 9 Perchlorate
- EPA Paper on Perchlorate Reductions
- DoD Perchlorate Resources
- AWWA Perchlorate Article
- ATSDR Perchlorate Toxicological Profile
- ATSDR Perchlorate Data
- EWG on Perchlorate
- 2010 GAO Perchlorate Report
- CDC on water quality
- CRS on SDWA
- Standardized Monitoring Framework
- Standardized Monitoring Framework Quick Reference Guide
- Chemical Contaminant Rules Compliance for Primacy Agencies
- The Association of State and Territorial Solid Waste Management Officials 2011 perchlorate policy update